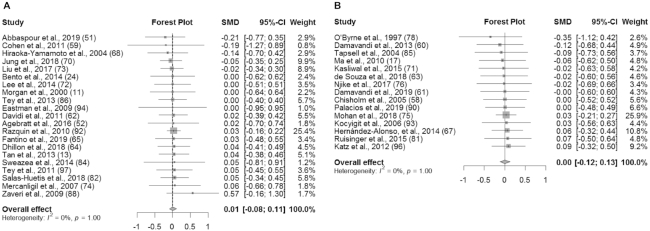
FIGURE 3.
Forest plot of BMI (kg/m2) for studies without dietary substitution instructions (A) and BMI for studies with dietary substitution instructions (B). For each individual study, the square represents the SMD in BMI between the intervention and control groups. The area of the square is proportional to the weight. Horizontal lines represent 95% CIs. SMD, standardized mean difference.

