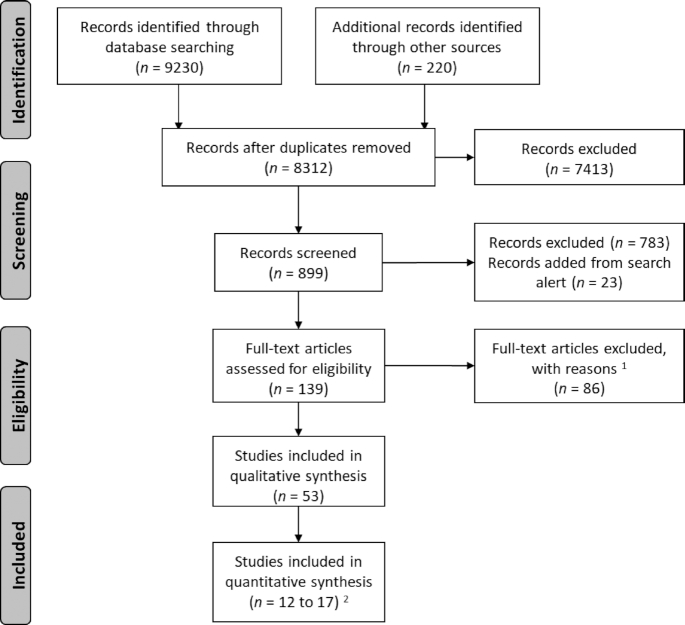
FIGURE 1.
Preferred Reporting Items for Systematic Reviews and Meta-Analyses flow chart study inclusion/exclusion. 1Reasons for exclusion: see Methods. 2For each category of outcome, the number of included studies varied in meta-analysis: 15 included for fasting glucose concentration (21–35); 12 for total cholesterol concentration (21–24,27, 28, 31, 34–38); 17 for blood pressure, same for systolic and diastolic blood pressure (21–23, 27, 31,34, 37, 39–41, 42–45, 46–48); and 14 for BMI (21–23, 25–27,31, 34, 39, 42, 46, 47, 49, 50).

