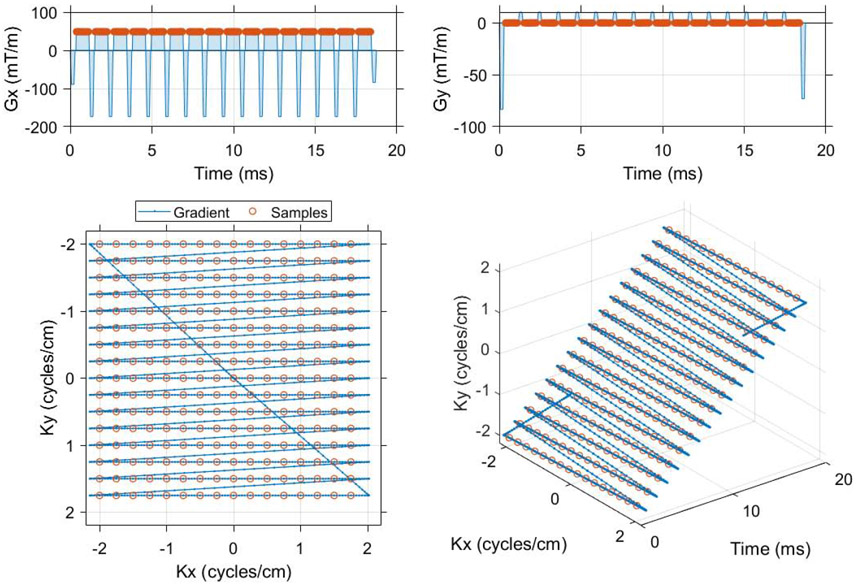
Figure 1.
The single shot EPI trajectory designed in MATLAB that was used to compare spectral encoding strategies for imaging of [1-13C]pyruvate and associated metabolites. Flyback and symmetrically sampled EPI waveforms were created as a function of matrix size, field of view and readout bandwidth (code available online, https://github.com/mda-mrsl/PV6-HPMR/blob/master/matlab/design/create2dEpi.m). This flyback EPI readout has a 16 x 16 matrix, 4 cm field of view and 20.833 kHz readout bandwidth (48 μs dwell time). The center of k-space is sampled 9.984 ms into the gradient waveform, which has a total duration of 18.76 ms and an echo spacing of 1.152 ms (868 Hz phase bandwidth).

