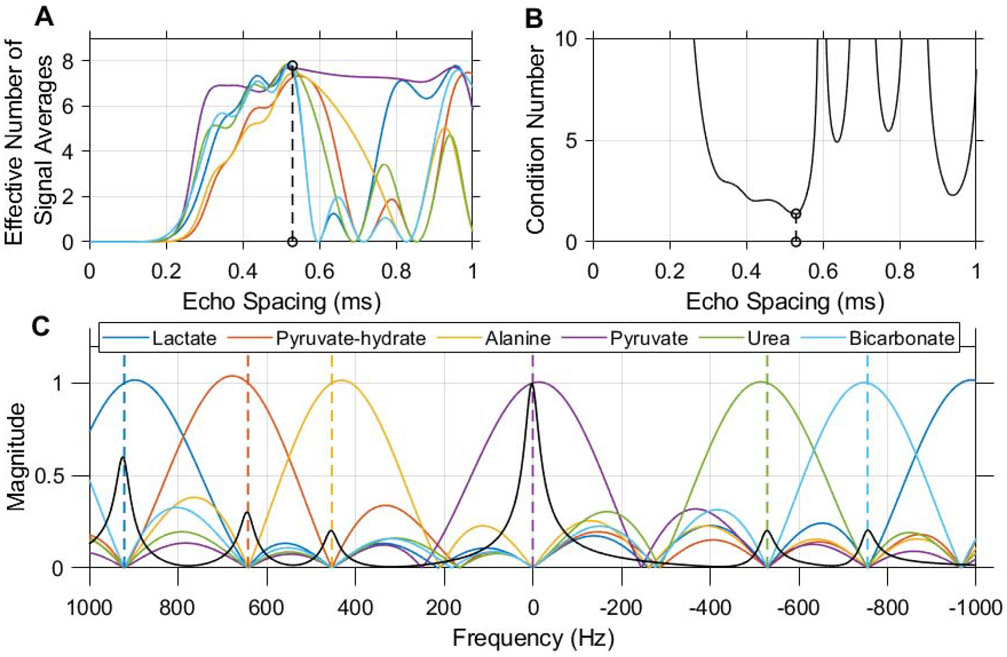
Figure 3.
An echo spacing of 0.52 ms with 8 echoes was chosen for multi-echo CSE of 13C urea, [1-13C]pyruvate and associated metabolites at 7 T. This echo spacing minimizes the condition number of the CSE phase coefficient matrix (B) and optimizes noise performance in the resulting individual chemical shift images (A). Without demodulation of B0 inhomogeneity, this CSE decomposition is simply a linear transform whose frequency response is characterized in the magnitude plot shown here (C). Dashed vertical lines indicate the center frequency of each resonance at 7 T when the scanner frequency is set to pyruvate. A synthetic spectrum depicting HP pyruvate and other expected 13C signals is plotted in black with the magnitude of the frequency response (C) in order to illustrate the potential for spectral misregistration of HP signals due to off-resonance effects.

