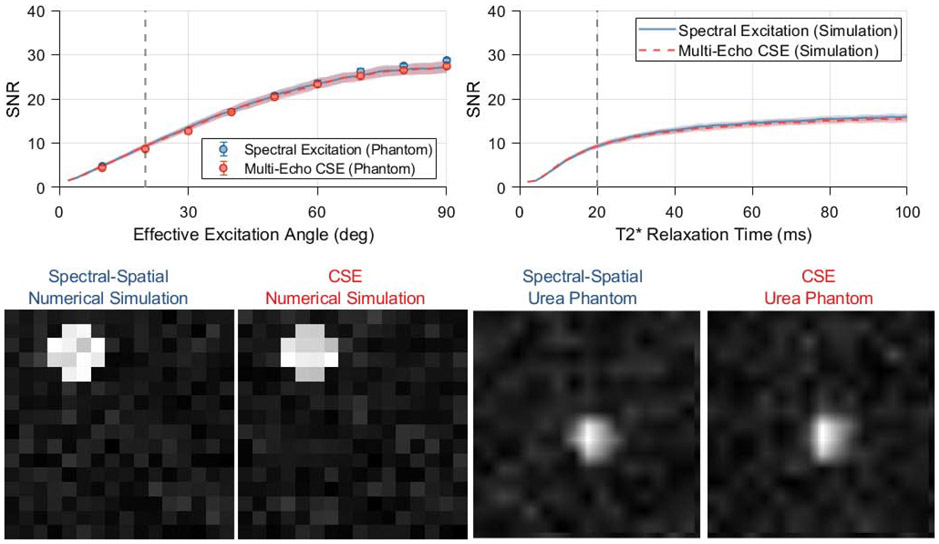
Figure 4.
Simulations comparing spectral encoding strategies for imaging of [1-13C]pyruvate and its associated metabolites at 7 T. The mean output SNRs for a single metabolite are summarized as a function of effective excitation angle and T2* relaxation time constant in the plots in the upper row. The lines and shaded regions depict one standard deviation about the mean for numerically simulated data. Vertical dashed lines indicate the standard value of each parameter that is used when plotting other parameters and displaying the numerical phantom images (lower left). Images from a thermal phantom experiment corresponding to 20 degree effective excitations are shown in the bottom right. SNR values were measured in eight repetitions of this phantom imaging experiment at various effective excitation angles, and are plotted with numerical simulation results in the upper left. Phantom data show a significantly lower SNR for multi-excitation CSE at effective excitation angles ≥70 degrees (* p<0.05, two-sample t-test), however the effect size is miniscule and not practically meaningful.

