
Figure 5. Computational pipeline to identify enhancer modifying variants.
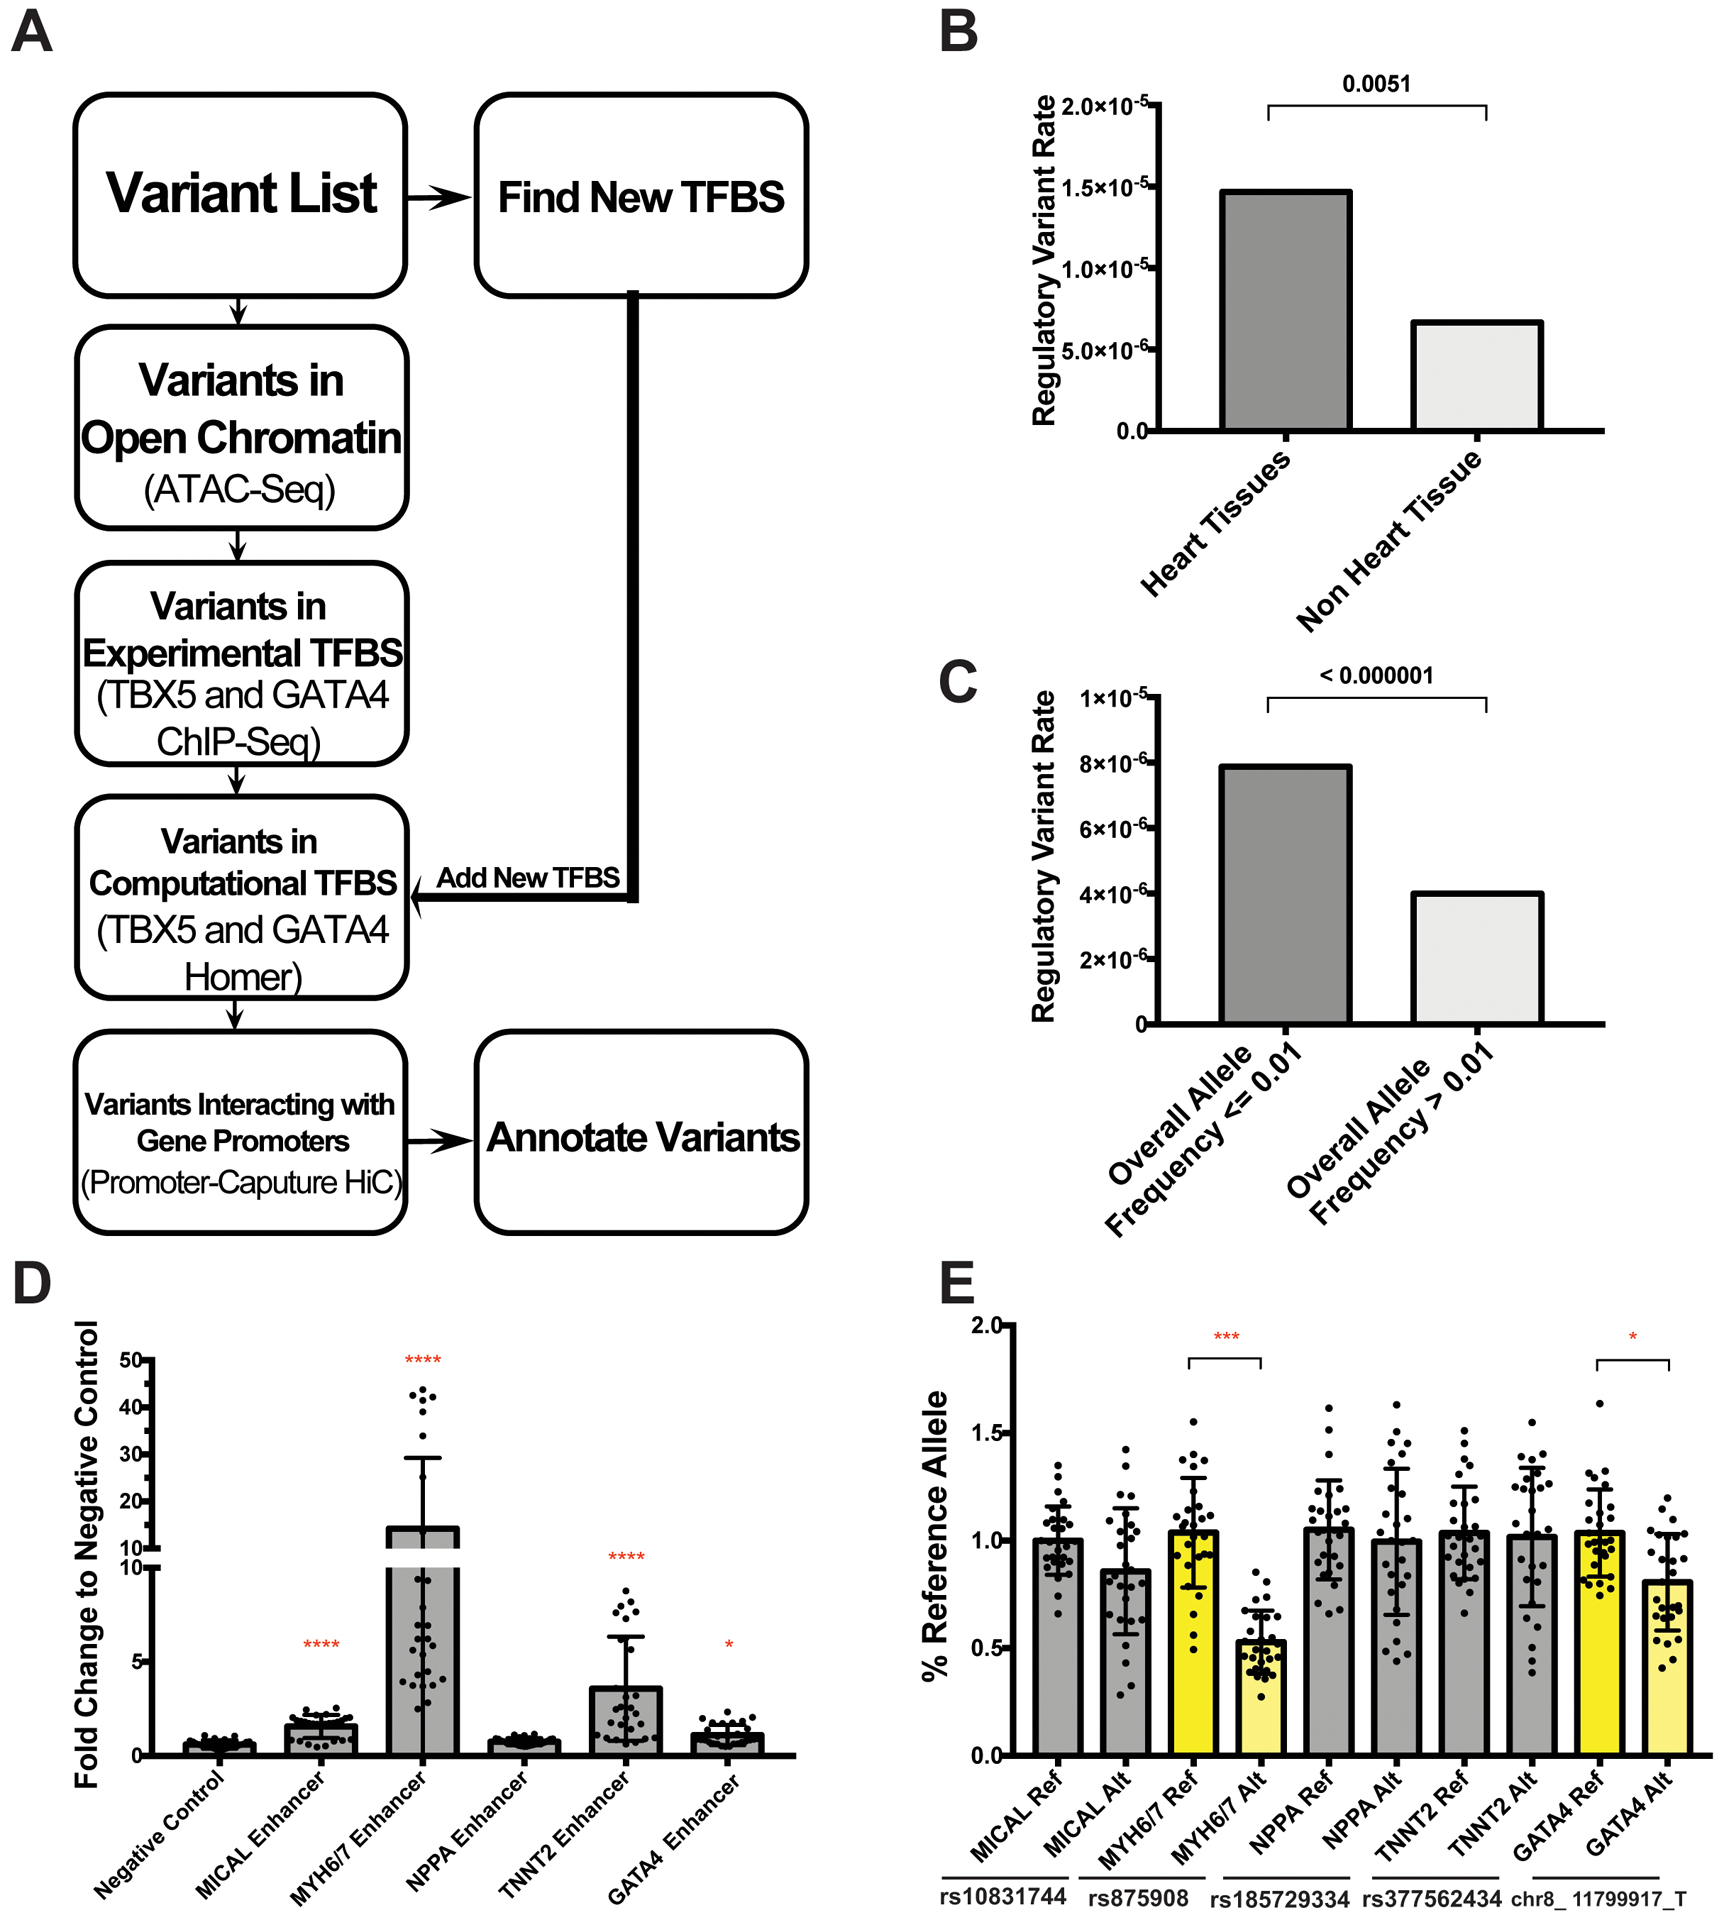
A. Schematic showing the pipeline filtering steps used to identify enhancer modifying variants (EMVs) genome-wide. B. This strategy disproportionately identified significant GTEx eQTLs from heart tissues versus non-heart tissues, and disproportionately identified rare alleles, indicating both tissue specificity and sequence conservation. C. Significance determined in B & C by Fisher’s exact test. D. Candidate enhancers for five genes were selected for testing in the luciferase reporter assay in IPSC-CMs. Four of five of these candidate regions validated as functional enhancer regions with signal greater than the negative control region (as tested in an average of 32 assays using four separate differentiations). Significance vs negative control was determined by nonparametric one-way ANOVA with Dunn’s multiple comparisons correction. E. We then tested the reference and alternate alleles to assess whether the alternative variant shifted activity. The enhancer modifying variant in MYH6/7 and in GATA4 significantly changed expression (highlighted in yellow) (data derived from an average of 27 assays per condition, from four separate differentiations). Significance determined by unpaired t-test. All data shown as mean ± SD. *<0.03, ***<0.0002, ****<0.0001.