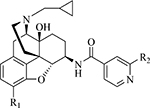
Table 1.
The Radioligand Binding Affinity to the KOR, MOR, and DOR and Selectivity Profiles of Compounds 1a-e and 6a-e.a
 | |||||||
|---|---|---|---|---|---|---|---|
| Compounds | R1 | R2 | Ki (nM) | Selectivity | |||
| KOR | MOR | DOR | μ/κ | δ/κ | |||
| 1a | OH | Cl | 0.15 ± 0.04b | 0.10 ± 0.04b | 602.20 ± 22.30b | 0.67 | 4015 |
| 6a | H | Cl | 10.46 ± 1.38 | 18.84 ± 3.01 | 2123.66 ± 101.18 | 1.8 | 203 |
| 1b | OH | Br | 0.18 ± 0.03b | 0.63 ± 0.18b | 173.70 ± 134.90b | 3.5 | 965 |
| 6b | H | Br | 7.44 ± 0.7 | 24.51 ± 3.23 | 2086.15 ± 71.59 | 3.3 | 280 |
| 1c (NCP) | OH | CN | 0.13 ± 0.01b | 1.25 ± 0.55b | 75.30 ± 7.00b | 9.6 | 579 |
| 6c | H | CN | 6.13 ± 0.74 | 58.27 ± 5.16 | 3375.73 ± 743.96 | 9.5 | 551 |
| 1d | OH | CH3 | 0.58 ± 0.12b | 0.39 ± 0.20b | 90.10 ± 17.10b | 0.67 | 155 |
| 6d | H | CH3 | 96.07 ± 14.84 | 39.03 ± 2.56 | 3649.72 ± 158.17 | 0.41 | 38.0 |
| 1e | OH | OCH3 | 0.46 ± 0.04b | 0.60 ± 0.23b | 160.40 ± 6.60b | 1.3 | 349 |
| 6e | H | OCH3 | 86.91 ± 9.22 | 45.63 ± 4.59 | 5900.42 ± 300.78 | 0.53 | 67.9 |
The values are the mean ± SEM of at least three independent experiments.
Data have been reported in Reference [15], and are presented here for comparison purposes.
