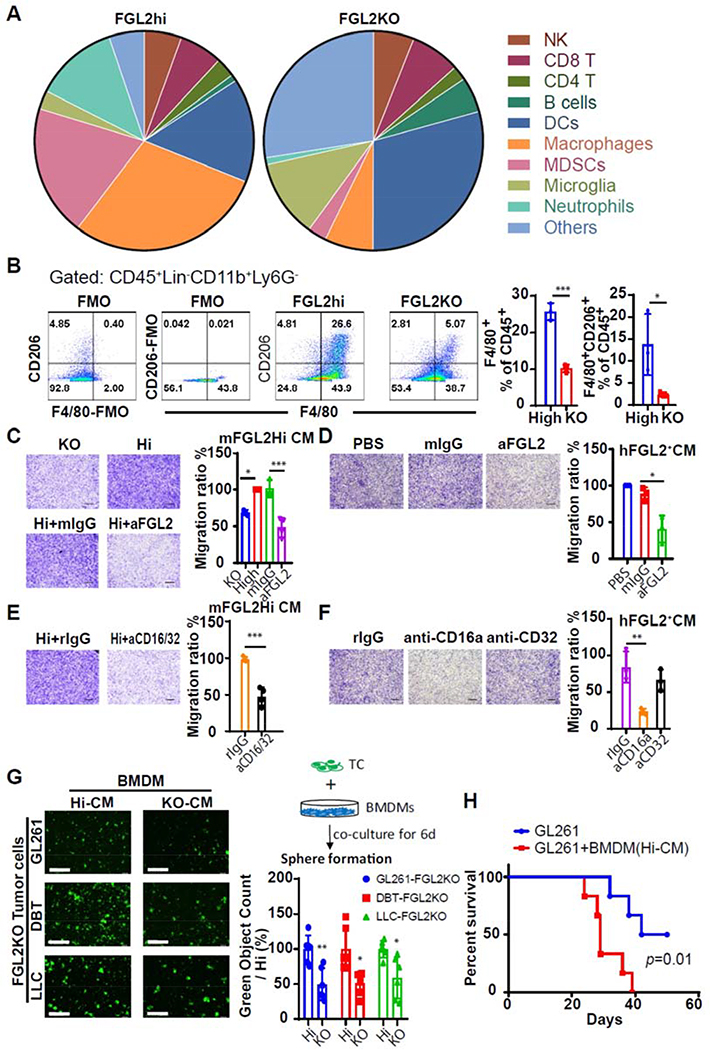
Fig. 2. Macrophages infiltrate into glioblastoma via the FGL2-CD16a axis and increase the ability of sphere formation of glioma cells.
(A), Pie charts showing percentages of a variety of immune cells in GL261-FGL2hi or GL261-FGL2KO-tumor bearing brains at 7 days after tumor implantation. (B), F4/80+CD206+ populations in BIL (n = 3).(C and E), Representative photos and quantification of relative migration of RAW264.7 macrophages following stimulation with conditioned media (CM) pretreated with/without anti-FGL2, anti-CD16/32 blocking antibody, or IgG (10 μg/mL) (n = 4). Scale bar, 500 μm. (D and F), Representative photos and quantification of relative migration of THP-1 macrophages following stimulation with CM pretreated with/without anti-FGL2, anti-CD16a, anti-CD32 blocking antibody, or IgG (10 μg/mL) (n = 3). Scale bar, 500 μm. (G), Sphere-formation capacity of tumor cells cocultured with CM-rewired BMDMs in cancer stem cell culture media. Left: representative photos of sphere formation in the indicated system. Right Top: schematic diagram of BMDM-driven sphere formation. Right Bottom: quantification of relative sphere formation. Scale bar, 400 μm. Data are presented as the mean ± SD and were analyzed by 1-way ANOVA (n = 6). (H), Survival curves of C57BL/6 mice (n = 6) implanted with GL261 or GL261+CM-rewired BMDMs. The survival curves were generated by Kaplan–Meier analysis, and the log-rank test was used to compare overall survival between groups. Representative data from 2–3 independent experiments are shown. *P < 0.05, **P < 0.01, ***P < 0.001.

