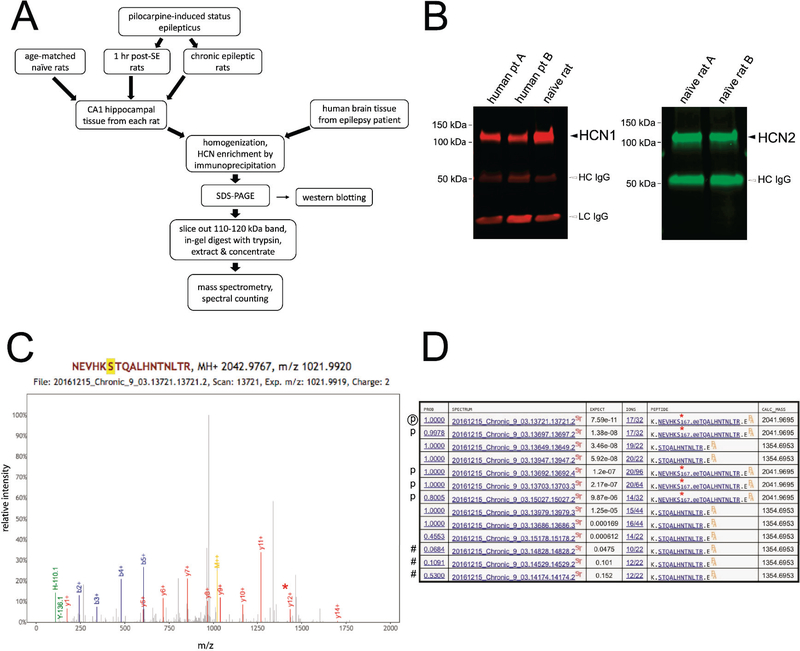
Figure 1.
Identification of HCN1 and HCN2 phosphosites. (A) Flowchart of methods used for identifying phosphosites within HCN1 and HCN2. (B) Western blot demonstrating successful immunoprecipitation of HCN1 and HCN2. Black arrowheads indicate HCN bands. HCN1 from rat and human brain tissues and rat brain HCN2 migrate approximately between 110–120 kDa. Open arrowheads indicate artifacts from the HCN enrichment process, where the heavy- and light-chain IgGs (HC-IgG, LC-IgG) originating from the antibodies used in IP co-elute with the proteins of interest. (C) Sample spectra from mass spectrometry. The peak containing phosphorylated S791 (y12+) is marked by the red asterisk. (D) Example of spectral counting. The list consists of all spectra derived from peptides containing S791 from a single homogenate sample. Spectra that do not meet the threshold (“expect” value ≤ 0.01) are not included in the count and are labeled with a “#”. Spectra that contain phosphorylated S791 are labeled with a “p” with the encircled “p” denoting the specific spectrum displayed in (C). A red asterisk denotes phosphorylated S791 within the sequences shown in the “PEPTIDE” column.

