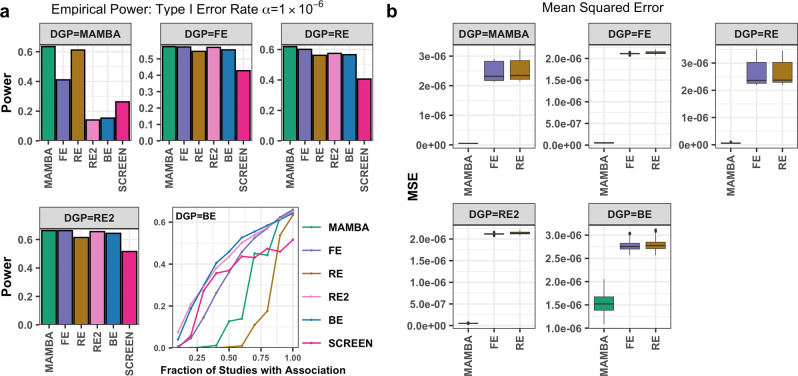
Fig. 2. Comparison of power and the mean square error for different methods in simulation studies.
a The power was evaluated using 1 million replications at the significance threshold of α = 1 × 10⁻⁶. b The mean-squared error for the genetic effect estimates were evaluated for MAMBA, fixed effect (FE) and random effect meta-analysis (RE). The RE2, BE, and SCREEN methods do not produce genetic effect estimates and thus were not considered. Scenarios under different data generation process (DGP) were considered. Source data are provided as a Source Data file.

