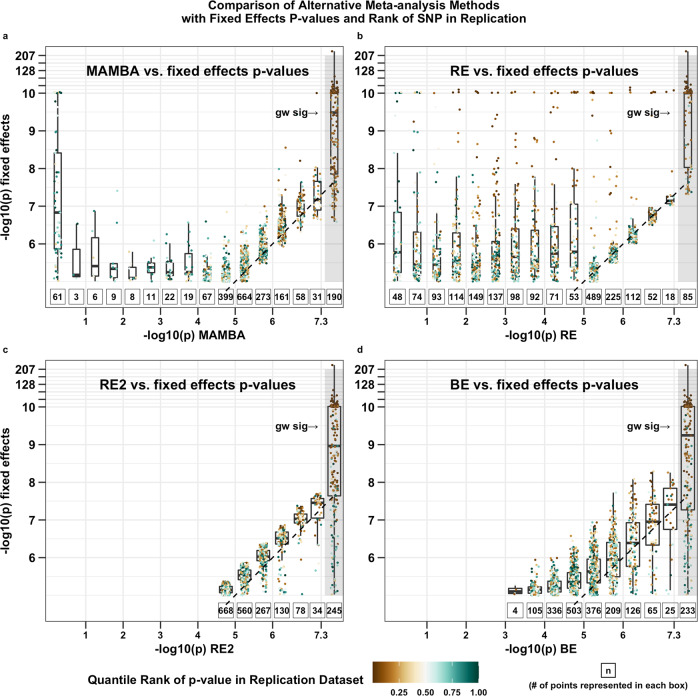
Fig. 4. Comparison of the p-values from MAMBA, RE, RE2, and BE meta-analysis with that of a fixed effects meta-analysis combined across all GSCAN addiction phenotypes in the discovery cohorts.
Each panel includes two-sided unadjusted p-values for 1,982 SNPs which were significant at P < 1 × 10⁻⁵ from a fixed effect meta-analysis and also tested in the replication dataset. We compare the p-values of fixed effect meta-analysis with those obtained from (a) MAMBA, (b) RE, (c) RE2, and (d) BE methods. The variants are colored by their p-values in the replication cohort, with brown dots indicating SNPs with the most significant replication p-values. The gray shaded region labeled ‘gw-sig’ indicates where the alternative method to fixed effects meta-analysis produces meta-analysis p-values < 5×10⁻⁸. The number of variants represented in each boxplot is denoted underneath the boxplot. Each boxplot denotes 25th percentile, median, and 75th percentiles with whiskers extending by 1.5 times the inter-quartile range below and above the 25th and 75th percentiles. For SNPs with more significant replication p-values, MAMBA produces similar results as fixed effect meta-analysis in the discovery cohorts. For SNPs with insignificant replication p-values, MAMBA produced much more conservative p-values in the discovery cohorts. Source data are provided as a Source Data file.

