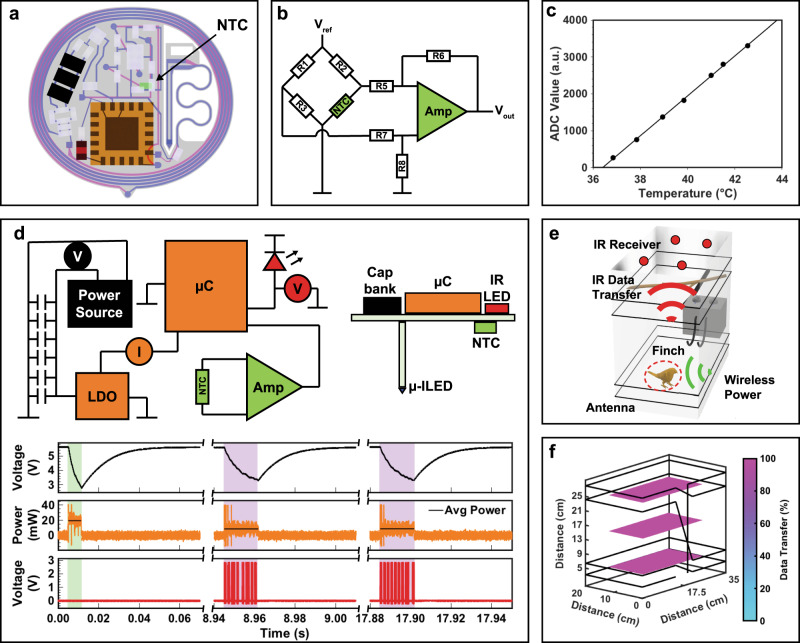
Fig. 4. Multimodal optogenetic stimulator and thermography device characterization.
a Layout of multimodal optogenetic stimulator and thermography device. b Electrical diagram of analog front end, indicating location of resistors, negative temperature coefficient (NTC) sensor, amplifier (Amp), reference voltage (Vref), and output voltage (Vout). c Calibration curve of ADC values and temperatures with 1.8 mK resolution. d Simplified electronic diagram (top left) and side view schematic of multimodal optogenetic stimulator and thermography device (top right) with voltage measurement of capacitor bank (black trace), power measurement of μC (orange trace), and voltage measurement of IR LED (red trace) (bottom). Green highlighted area indicates sampling of the ADC and writing of EEPROM and violet highlighted area indicates sending of 8-bit fragment. e Rendering of experimental arena showing data uplink and power delivery to animal with implanted device. f Spatial distribution of uplink stability.

