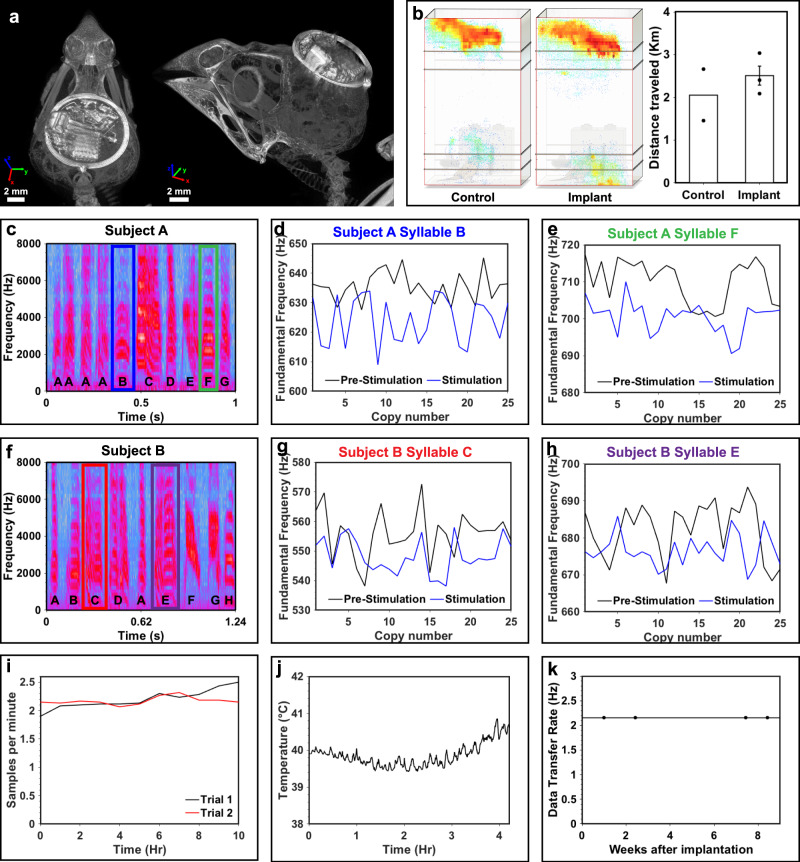
Fig. 5. Characterization of device platform in freely behaving birds.
a Axial CT slice of the multimodal optogenetic stimulator and thermography (left) and 3D rendered CT (right). b Heat maps showing animal model position over a 14-hour period imposed on a 3D rendering of the experimental arena for control and implanted subject (left). Measurement of distance traveled presented as mean values ± SEM for control (n = 2) and implanted (n = 3) subjects (right). c Spectrogram of bird song motif from finch subject A. The motif sequence of individual syllables is denoted by letters A–G. d Fundamental frequency (fo) scores of subject A and syllable B pre-stimulation (black line) and post stimulation (blue line) over a 30-minute period and 25 copies. e Fundamental frequency (fo) scores of subject A and syllable F pre-stimulation (black line) and post stimulation (blue line) over 25 copies. f Spectrogram of bird song motif from finch subject B. The motif sequence of individual syllables is denoted by letters A–H. g Fundamental frequency (fo) scores of subject B and syllable C pre-stimulation (black line) and post stimulation (blue line) over 25 copies. h Fundamental frequency (fo) scores of subject B and syllable E pre-stimulation (black line) and post stimulation (blue line) over a 15 min period and 25 copies. i Uplink rate of the multimodal optogenetic stimulator and thermography device for two 10 h trials. j Temperature measurement over 4 h with the multimodal optogenetic stimulator and thermography device. k Long term measurements of device uplink rate indicating stable data communication over the course of 9 weeks.

