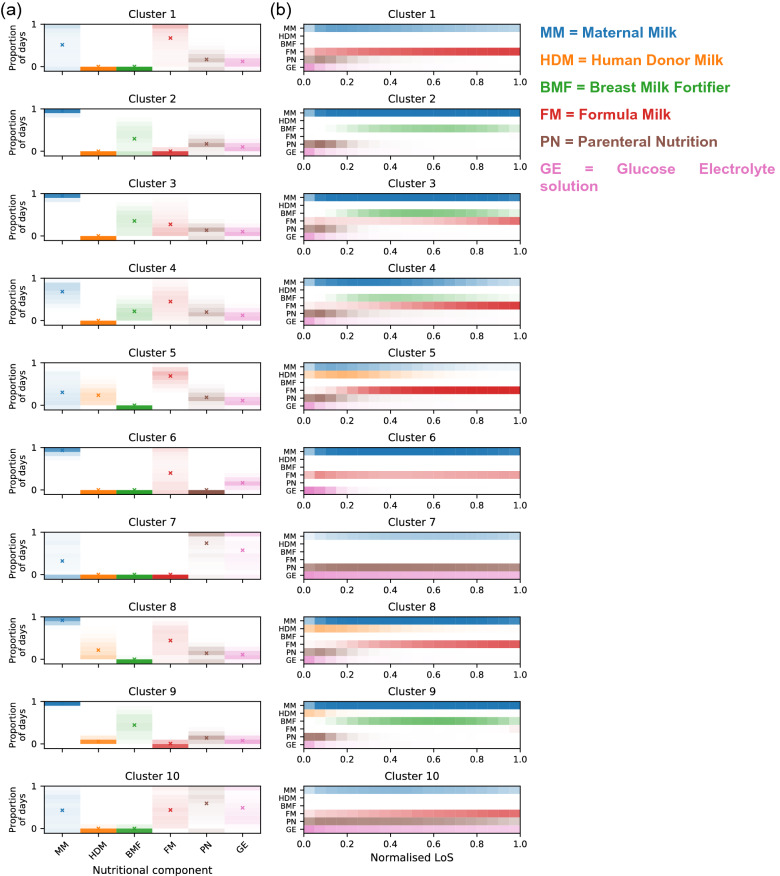
Figure 2.
Composition of the 10 most common nutritional patterns ordered by size from largest to smallest. Nutritional patterns are encoded as the proportion of days over total time in care a nutritional component was given (0 to 1). (a) Histograms of proportion of infants receiving a nutritional component (one per column) over a given proportion of days. Shading = one-dimensional histograms (11 bins-width = 0.1-including 0). Colour intensity = density of infants fed with that proportion over time in care and is maximal if all infants fall into a single bin. Cross (“x”) = mean proportion of days averaged across all infants in the cluster. (b) Timeline of nutritional components administration over normalised LoS (20 equal bins), computed as average temporal sequences of nutritional events over time in care. Maximal bin value (and colour intensity) attained if all infants in the cluster received a particular nutritional component every day in that time bin.

