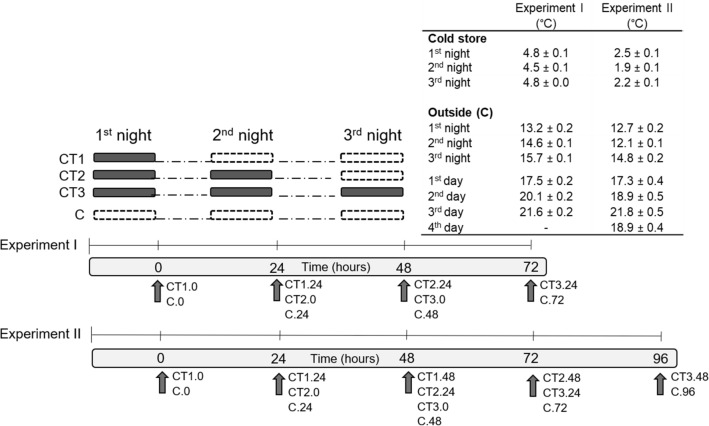
Figure 1.
Illustration of the experimental set up (CT1, CT2, CT3, chilling treatments; C, control), the sampling procedure/time (hours) and temperatures (presented as mean ± SE for night-time temperatures in cold store and outside and daytime temperatures; °C) for experiments I and II. A black filled rectangle indicates the night-time exposure to chilling temperature in cold store, while white filled rectangle indicates the night under natural conditions (outside). The arrows indicate the sampling time, with the list of measured CT.time levels next to the arrows.

