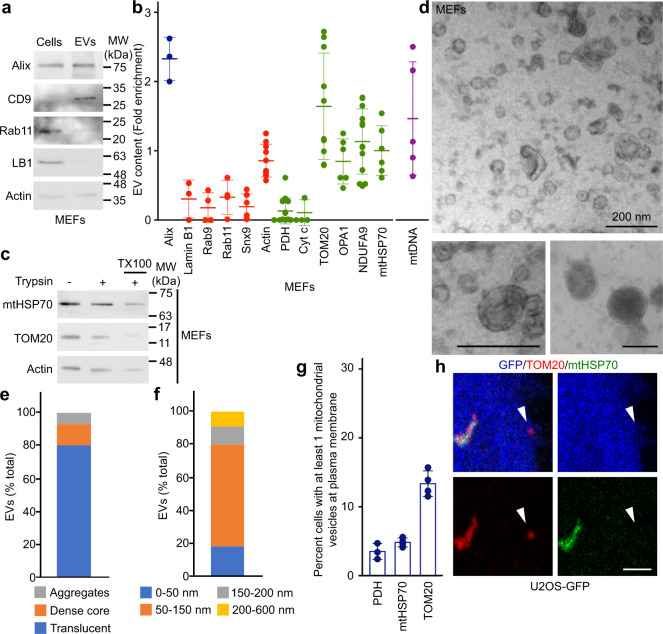
Fig. 2. Selective inclusion of mitochondrial proteins in EVs.
a EV markers were analysed by western blot in 20 µg cell extracts and 5 µg MEFs EVs isolated as in Fig. 1. b Quantification of protein inclusion in MEF EVs. The amount of the indicated protein present in EVs was normalised to its cellular content. Individual points represent independent experiments. Bars show the average ± SD. Alix, Exosome marker (blue); Lamin B1, nuclear protein; Rab9, Rab11, Snx9, endosomal proteins; Cyt c, IMS protein, OPA1, IM protein. Mitochondrial proteins (green), non-mitochondrial proteins (red), mtDNA (purple). c MEF EVs isolated as above were treated with Trypsin in the absence or the presence of detergent (TX100) and analysed by western blot for the presence of the indicated proteins. d–f MEF EV ultrastructure was analysed by EM and quantified based on structure (e) and size (f). Representative images are shown in (d). Scale bars, 200 nm. g, h Vesicles containing selective mitochondrial cargo are found in proximity to the plasma membrane (≤1 µm) but away from the main mitochondrial network (>1 µm). The number of TOM20-positive, mtHSP70-positive or PDH-positive vesicles are quantified in (g) with individual points representing the fraction of cells with plasma membrane-associated vesicles in four independent experiments. Each positive cell typically contained one vesicle. Points show independent experiments and bars show the average ± SD. A representative image is shown in (h) with GFP (blue) used as a cytosolic marker to identify cellular boundaries. The arrowhead denotes a TOM20-positive vesicle close to the plasma membrane. Scale bar, 2 µm.

