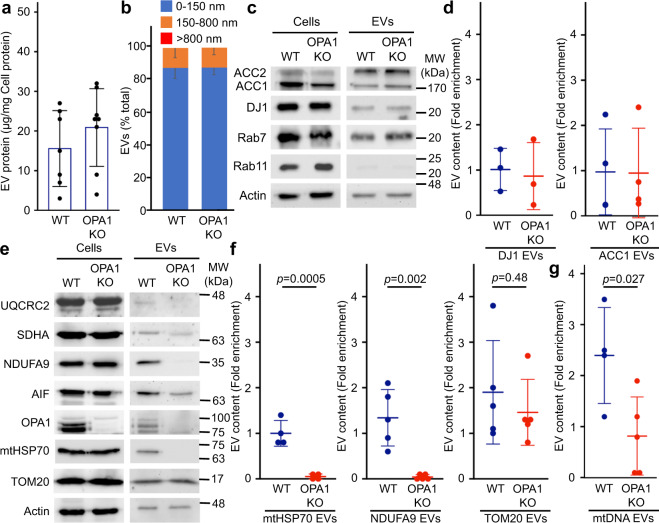
Fig. 5. OPA1 regulates the inclusion of IM/matrix proteins and mtDNA into EVs.
a Quantification of EV protein yields relative to cellular protein content in WT and OPA1 KO EVs isolated as in Fig. 1. Each point represents one experiment (n = 7). Bars show the average ± SD. b OPA1 deletion does not alter overall EV size. WT and OPA1 KO EV size was analyzed by EM and binned as indicated. The average percent of EVs in each category ± SD is shown (n = 3). No EVs larger than 800 nm were detected. c, d The inclusion of cytoplasmic proteins into EVs is not altered following OPA1 deletion. Representative western blot (c) and quantification (d) as in Fig. 1. Individual points represent independent experiments (n = 3). Bars show the average ± SD. e–g The inclusion of IM/matrix proteins, but not TOM20, into EVs is prevented by OPA1 deletion. Representative western (e) and quantification as in Fig. 1 (f). mtDNA was quantified by PCR (g) Individual points represent independent experiments. Bars show the average ± SD. Two-sided t-test. WT (blue), OPA1 KO (red).

