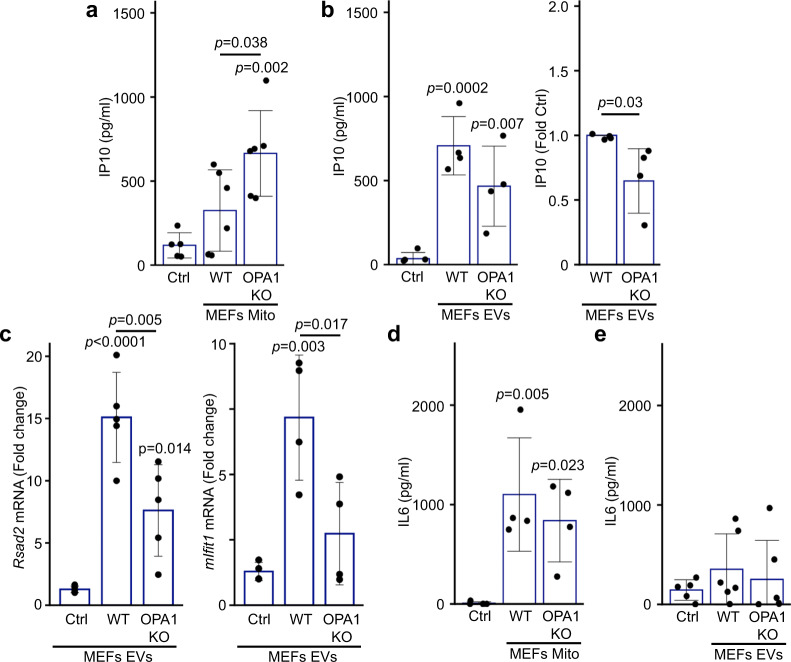
Fig. 6. OPA1 KO mitochondria but not EVs isolated from the same cells induce an IP10 inflammatory response.
a, b RAW cells were treated as in Fig. 1 with mitochondria (Mito, 12 µg) (a) or EVs (from 10 × 106 cells) (b) isolated from WT or OPA1 KO MEFs and IP10 release in culture media measured by ELISA. Individual points represent actual concentrations (or normalised to WT for (b), right panel) in independent experiments (Mito, n = 6; EVs, n = 4). Bars show the average ± SD. One-way ANOVA, two-sided t-test for (b), right panel. c OPA1 KO EVs show reduced expression of IFN-dependent genes. RAW cells were treated as in (a–b) and mRNA levels of the IFN-dependent genes Rsad2 (left) and mIfit1 (right) measured by qPCR. Individual points represent independent experiments (Rsad2, n = 6; mIfit1, n = 4). Bars show the average ± SD. One-way ANOVA. d, e RAW cells were treated as in (a, b) and IL6 was measured in the culture media by ELISA. Individual points represent independent experiments (Mito, n = 4, EVs, n = 5). Bars show the average ± SD. One-way ANOVA.

