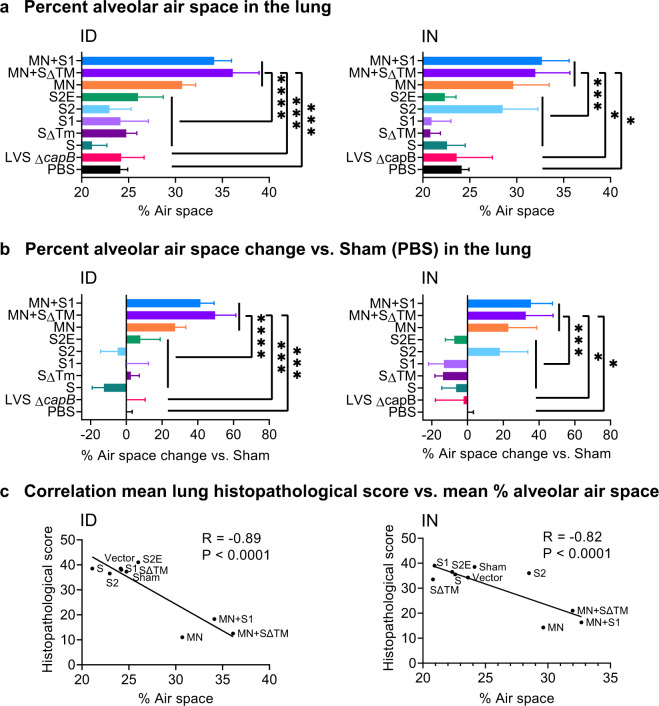
Fig. 5. Percent alveolar air space and correlation between lung histopathological score and percent alveolar air space.
a Percent alveolar air space was quantitated as described in “Methods” at Day 7 post 105 CFU SARS-CoV-2 intranasal challenge in lungs of hamsters immunized ID (left) or IN (right) with the indicated vaccines. b Percent alveolar air space vs. Sham (PBS) [(Air space of immunized animal − Mean air space of Sham)/Mean air space of Sham]. a, b Shown are means + SE. Animals immunized with PBS (Sham), LVS ΔcapB (Vector), the S vaccines (S, SΔTM, S1, S2, and S2E), and the MN vaccines (MN, MN + SΔTM, and MN + S1) were compared by ANOVA (JMP 15.0); *P < 0.05; ***P < 0.001; and ****P < 0.0001. c Correlation between mean lung (cranial and caudal) histopathological score and mean percent alveolar air space for ID (left) and IN (right) vaccination route (Prism 9.0.0). In addition, the correlation between lung histopathological score and mean percent alveolar air space for individual animals is R = −0.74 (P < 0.0001) (ID) and R = −0.80 (P < 0.0002) (IN) (JMP 15.0).

