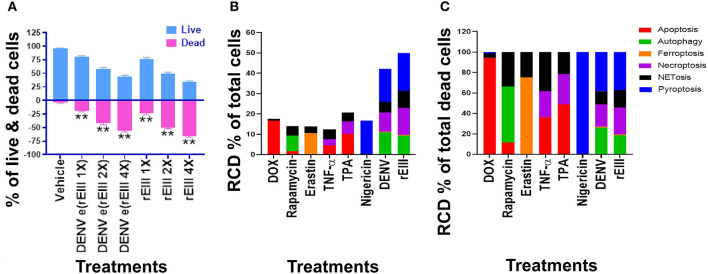
Figure 3.
DENV- and rEIII-induced regulated cell death in neutrophils. (A) Wild type mouse neutrophils treated (1 h) with vehicle and various doses of DENV and rEIII; the live and death cell populations were revealed by Zombie-NIR Kit labeling and flow cytometry analysis. [rEIII 1× = 0.3 μM, 2× = 0.6 μM, 4× = 1.2 μM,; DENV e(rEIII 1×) is a DENV level equivalent to 0.3 μM rEIII, as indicted by the methods described elsewhere (33)]. (B) Treatments (1 h) of regulated cell death (RCD) inducers, doxorubicin (DOX; apoptosis) (2.5 μg/mL), rapamycin (autophagy) (0.5 μM), erastin (ferroptosis) (10 μM), TNF-α (necroptosis) (2.5 ng/mL), TPA (NETosis) (2 nM), and nigericin (pyroptosis) (3.5 μM) induced relatively simple RCD patterns. By contrast, DENV and rEIII induced multiple RCD pathways, in which pyroptosis is the major RCD response, counts ~40% of total RCD and the NETosis response displays only ~20% total RCD. (C) If the respective RCDs are normalized by the population of death cells (dead cell population normalized to 100%), we can obtain a more similar RCD pattern in DENV and rEIII groups (flow cytometry gating and calculation methods described in Supplementary Figure 2). DENV 1× = 4.2 × 10⁴ PFU/mL, 2× = 8.4 × 10⁴ PFU/mL, 4× = 1.7 × 10⁵ PFU/mL; **P < 0.01 vs. vehicle groups.

