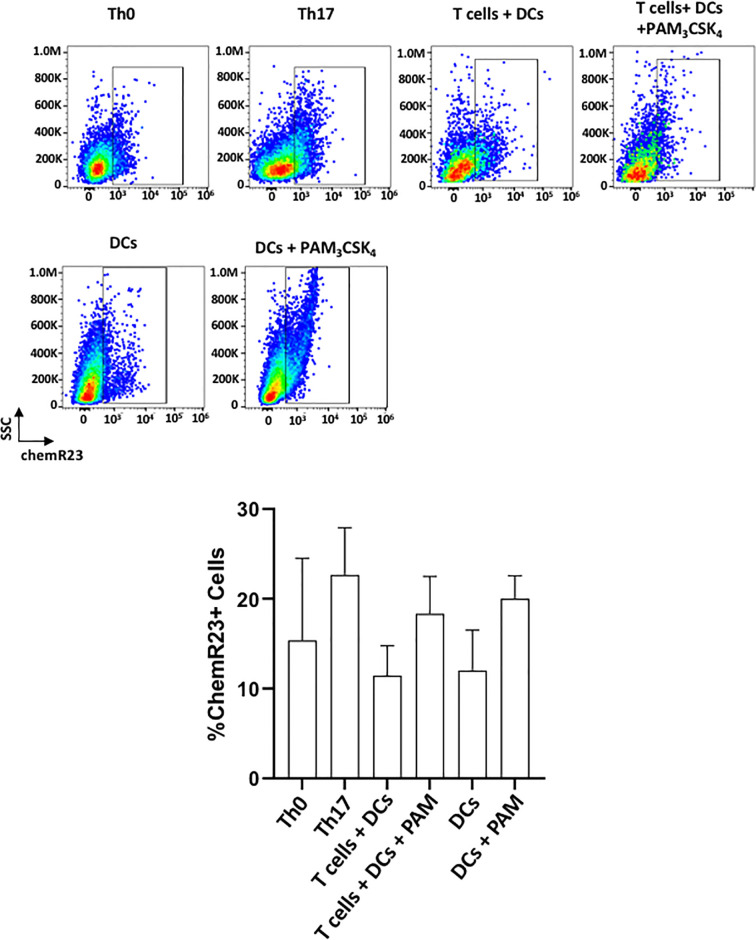
Figure 6.
chemR23/ERV1 is expressed on T cells+ and DCs. Representative flow cytometric data (above) and proportion (below) of cells showing chemR23 expression on Th0 cells (CD4+ T cells + ab-CD3/CD28), Th17 cells (CD4+ T cells+ ab-CD3/CD28+ TGFβ/IL-6), T cells-DCs coculture, T cells-DCs co-culture with PAM3CSK4 stimulation, DCs and DCs with PAM3CSK4 stimulation. Results shown are ± sem for three independent experiments.

