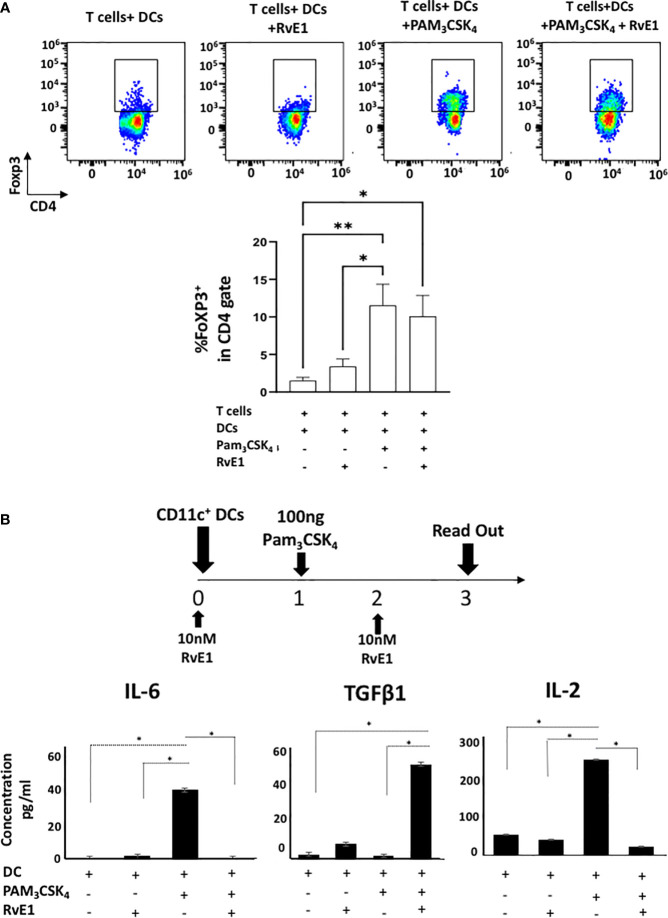
Figure 7.
(A) shows representative flow cytometric data (above) and proportion (below) of FoXP3+ cells in CD4+ gate in T cells+ DCs, T cells+DCs+RvE1, T cells+ DCs+ PAM3CSK4 and T cells+ DCs+ PAM3CSK4+ RvE1. Naive CD4+ T cells were cocultured with dendritic cells and stimulated by PAM3CSK4, RvE1 treatment was applied baseline and on day 3 to the assigned groups. Cells were incubated at 37°C for five days, and on day 5. PMA/ionomycin and monensin were applied to the cells for 6 hours before performing FACS analysis. (B) CD11c+ dendritic cells (2x10^5 cells/500 𝓂l) were treated with 10 nM RvE1 for 24 hours and then induced with 100 ng PAM3CSK4 for 48 hours. One more dose of RvE1 was applied on day 2. (B) shows secreted cytokine levels by dendritic cells; Supernatants were collected on day 3; IL-6 and TGFβ were analyzed by AYOXXA and IL-2 by LUMINEX. Results shown are means ± sem for at least four independent experiments *p < 0.05, **p < 0.01.

