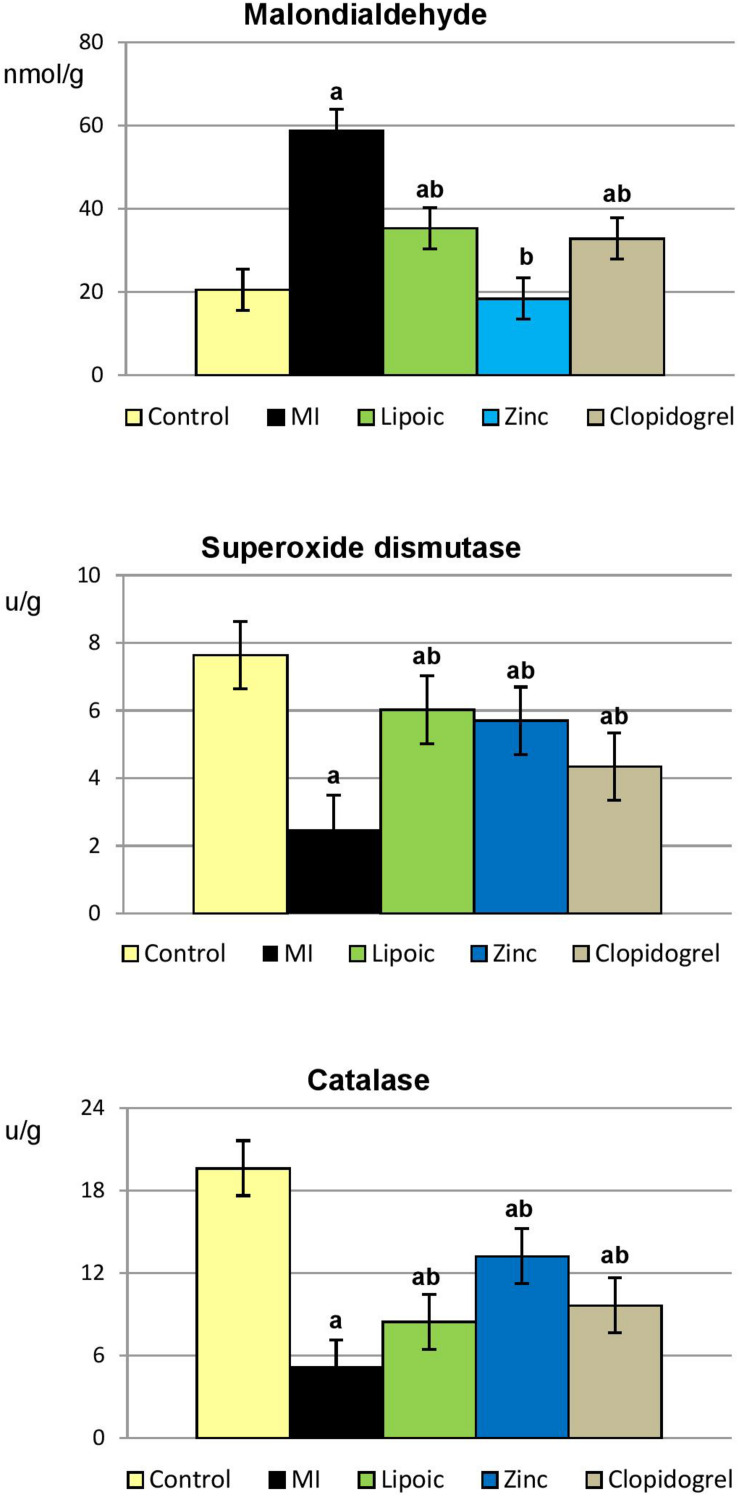
FIGURE 6.
Myocardial tissue oxidative stress parameters in the control, untreated myocardial infarction (MI) and pre-treated (lipoic acid, zinc sulfate, and clopidogrel) groups. Results are represented as mean ± SEM, significance of differences is calculated by Student’s t-test for unpaired data at p < 0.05; a—vs. controls, b—vs. MI group.

