FIGURE 2.
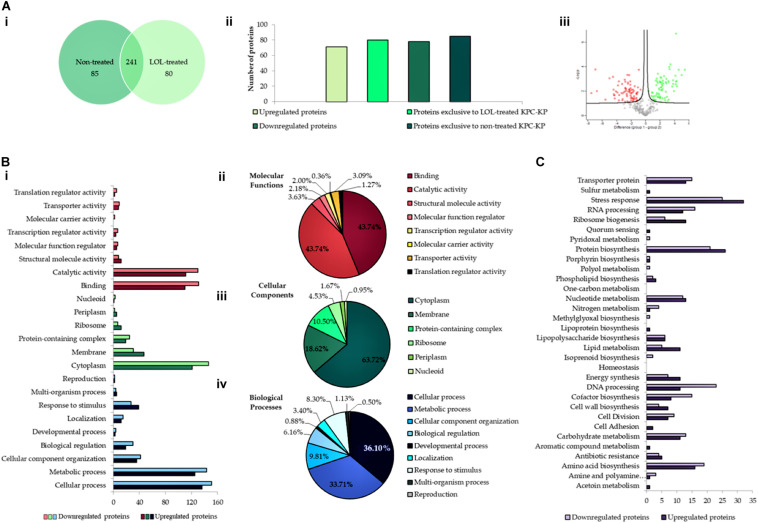
Comparative proteomic analysis between nontreated and linalool-treated KPC-KP cells. (A-i) Venn diagram of the total protein obtained from nontreated and linalool-treated KPC-KP cells. (A-ii) The total numbers of exclusive, upregulated and downregulated proteins. (A-iii) Volcano plot showing up- (designated green square) and downregulated (designated red square) proteins of the linalool-treated KPC-KP cells. Gene Ontology (GO) analysis of identified proteins and their relative abundance (B-i) in terms of molecular function (B-ii), cellular components (B-iii), and biological processes (B-iv) of linalool-treated KPC-KP cells. (C) KEGG pathway analysis of differentially expressed proteins in linalool-treated KPC-KP cells. The proteomic analysis is detailed in Supplementary Spreadsheet S1.

