
Fig. 5. Gene expression patterns and oxidative DNA damage in C. rubrum exposed to different levels of microplastic concentrations after 10 days of experimental incubation.
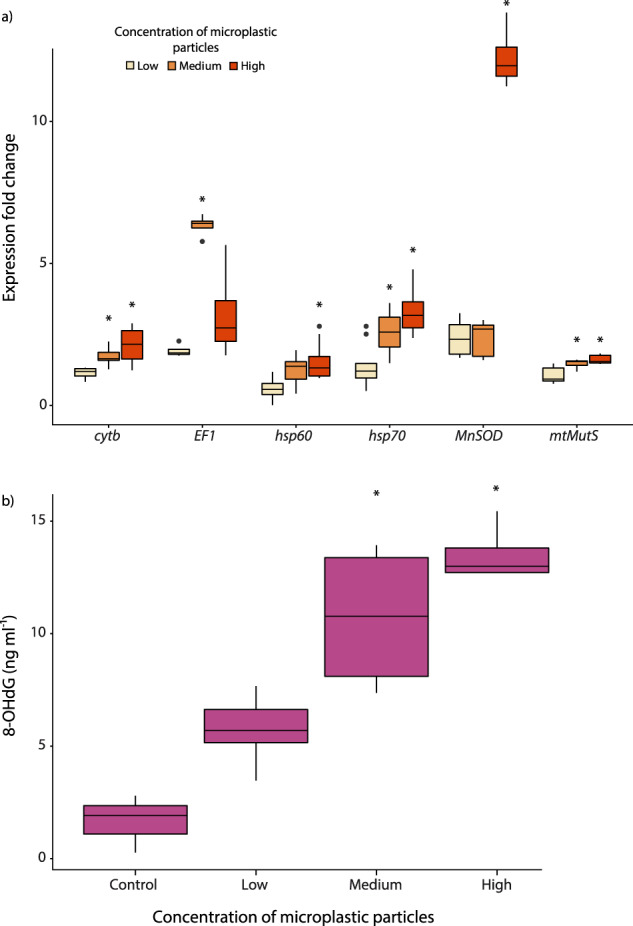
a Expression fold change of six genes (cytb, mtMutS, hsp70, hsp60, EF1, MnSOD) obtained by real-time qPCR; b 8-hydroxydeoxyguanosine (8-OHdG) levels obtained by ELISA. Average value and standard deviation (±) are reported. Significant differences for the expression of each gene and for 8-OHdG levels compared to the controls (corals not exposed to microplastics) are highlighted with asterisks: *P < 0.05.