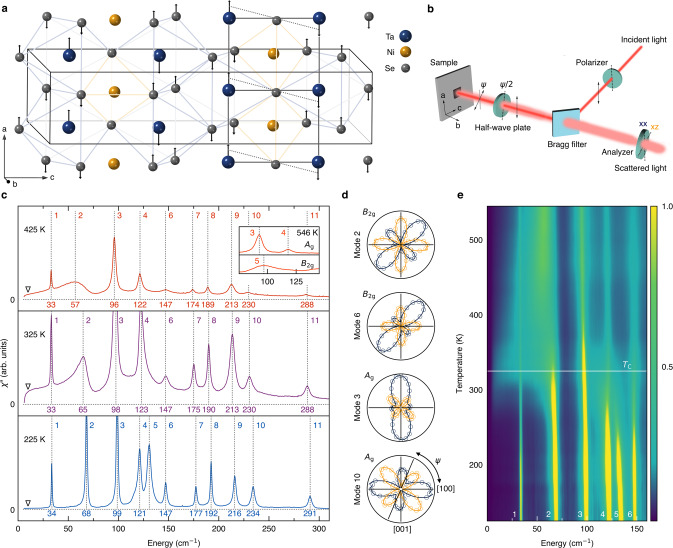
Fig. 1. Raman-active phonon modes and a quasi-elastic peak.
a Crystal structure of Ta2NiSe5, overlaid with the displacement vectors (×50) in the orthorhombic-to-monoclinic transition. The black solid box shows the unit cell. The gray solid and dotted lines visualize the shearing of the quasi-one-dimensional Ta-Ni-Ta chain along the a-axis by the monoclinic distortion. b Experimental configuration of the Raman measurements. c, Unpolarized Raman spectra at T = 225 K (blue), 325 K (purple), and 425 K (red). All of the eleven Raman-active modes are labeled in the order of increasing energy, and the quasi-elastic peak (QEP) is marked by an inverted triangle. The inset shows symmetry-resolved Raman spectra at T = 546 K. d Azimuth-angle dependence of the polarization-resolved Raman scattering intensity. Ψ measures the angle between the a-axis and incident polarization, and navy (yellow) color represents the scattered-light polarization parallel (perpendicular) to the incident one. The Ag(B2g) spectrum in the inset of (c) is isolated by measuring in the cross-polarization channel at Ψ = 45∘(Ψ = 0∘). e False color map of the unpolarized Raman spectra from 120 to 550 K. TC = 325 K is indicated by the white horizontal line.

