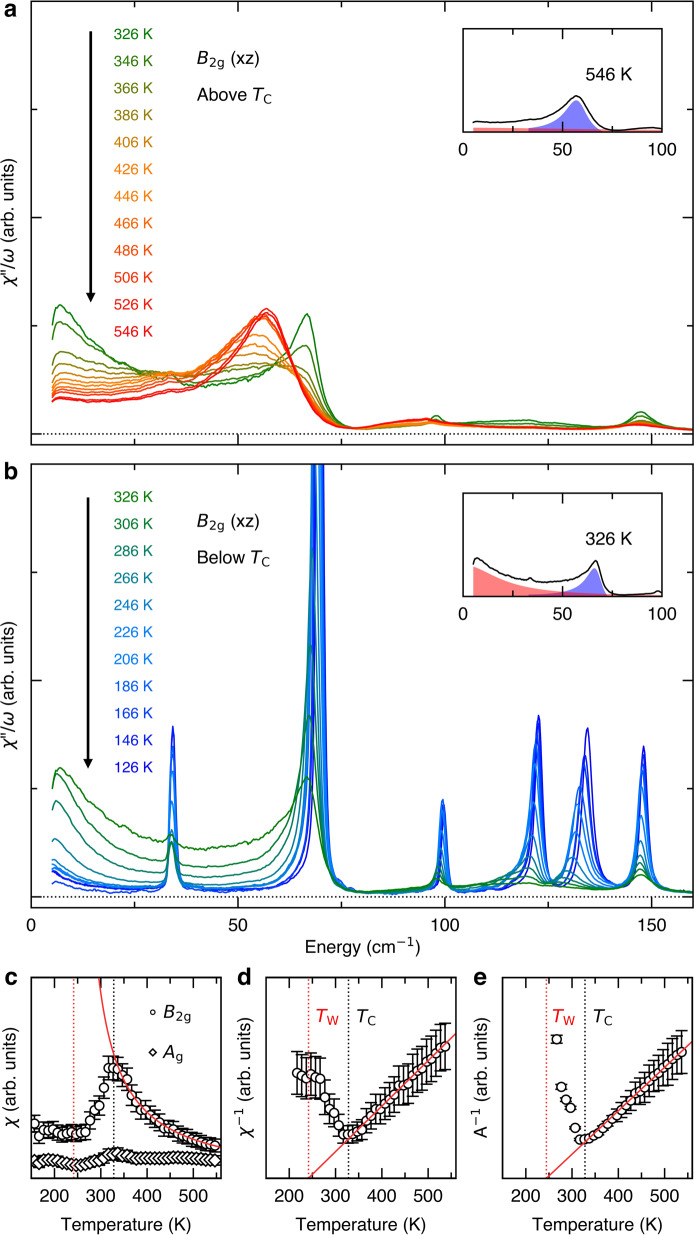
Fig. 2. Static susceptibility extracted from Raman spectra.
a, b Raman conductivity χ″/ω measured above and below the TC, respectively. The insets show representative fitting of the QEP (red) and mode 2 (blue). c The real part of the uniform static susceptibility obtained from integrating the Raman conductivity after subtracting the phonon contribution. The B2g susceptibility (circles) follows a Curie-Weiss behavior, whereas the Ag signal (diamonds) is nearly temperature independent. Black and red vertical lines indicate TC and TW, respectively. d, e The temperature dependence of the inverse susceptibility and the inverse amplitude of the QEP, respectively. Red solid lines show the linear fits near the TC. The error bars are defined by one standard deviation for the extracted values.

