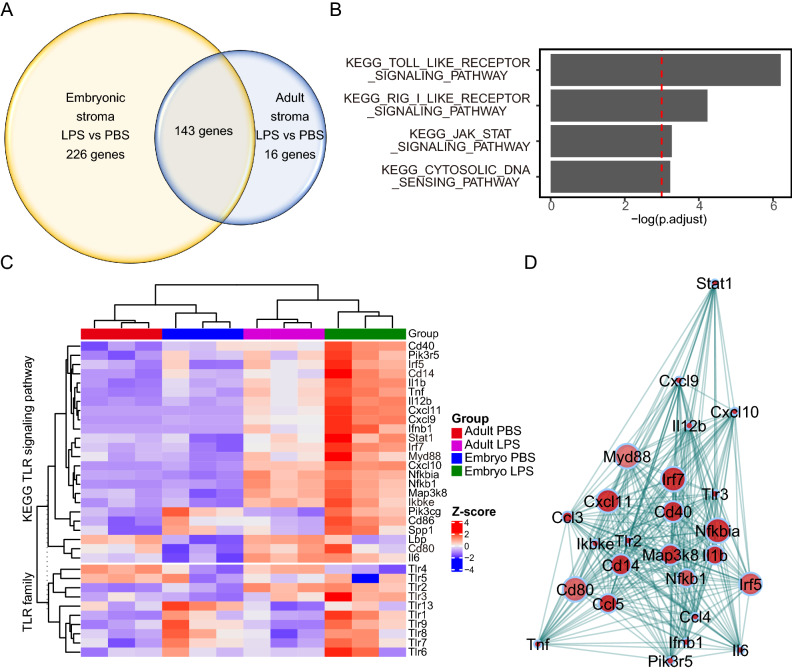
Figure 2.
Identification of key genes differentially expressed by the immature mouse intestinal stroma upon inflammatory stimulation ex vivo. (A) Venn diagram showing the number of differentially expressed genes (DEGs) in primary adult or embryonic intestinal stromal cells treated with LPS in comparison to vehicle controls. 3 independent cultures generated from 3 adult mice or 6 pooled embryos/culture were sequenced. DEG had absolute value of log2 fold change ≥ 2.0, FDR < 0.05. (B) Significantly enriched KEGG pathways for 226 genes differentially expressed in LPS stimulated embryonic stromal cells. FDR < 0.05. (C) Heatmap generated using ComplexHeatmap R package version 2.1.027 depicting unsupervised clustering of TLR and TLR pathway component expression in LPS or control vehicle treated embryonic and adult stromal cells ex vivo. (D) Network visualization constructed using R package WGCNA28 of the correlation between DEG in LPS stimulated embryonic stromal cells in the KEGG TLR signaling pathway. Each dot represents a gene, dot interior colour denotes upregulation (red) of gene transcript in LPS treated cells compared to PBS treated cells, dot size indicates the magnitude of gene expression correlation to neighboring genes, lines connecting dots represent topological distance.

