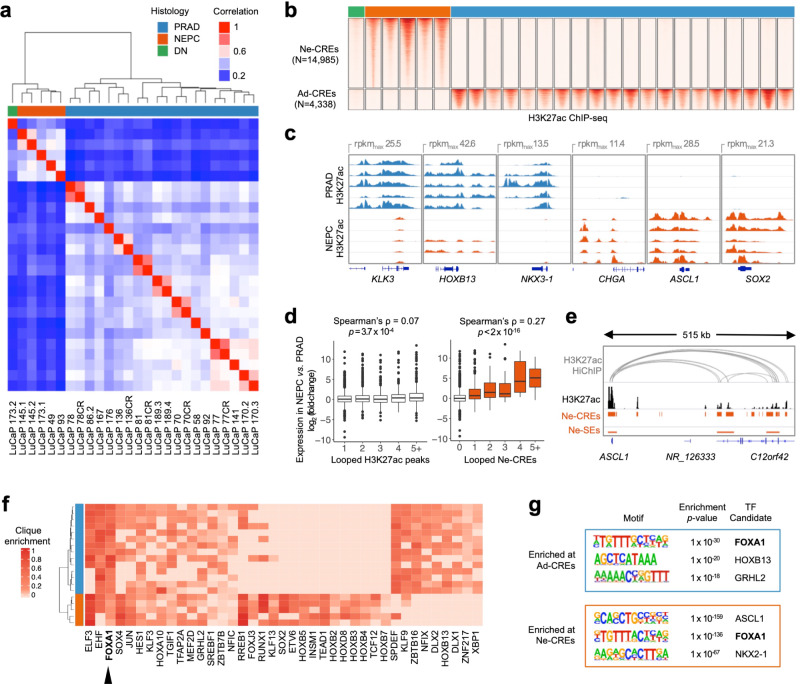
Fig. 1. Epigenomic divergence of PRAD and NEPC.
a Hierarchical clustering of PRAD and NEPC based on sample-to-sample correlation of H3K27ac profiles. “DN” (“double-negative”) indicates a LuCaP PDX without AR or NE marker expression (see also Supplementary Fig. 1). b Heatmaps of normalized H3K27ac tag densities at differentially H3K27-acetylated regions (±2 kb from peak center) between NEPC and PRAD. “CREs” signify candidate regulatory elements. c H3K27ac signal near selected prostate-lineage and NEPC genes. Five representative samples from each histology are shown. d Differential expression (NEPC vs. PRAD) of genes with the indicated number of distinct looped H3K27ac peaks (left) or Ne-CREs (right) detected by H3K27ac HiChIP in LuCaP 173.1 (NEPC). Box boundaries correspond to 1st and 3rd quartiles; whiskers extend to a maximum of 1.5x the inter-quartile range. Two-sided Wilcoxon p-value is indicated for comparison of genes with loops to one Ne-CRE or H3K27ac peak versus two or more. e H3K27ac HiChIP loops in LuCaP 173.1 from ASCL1 to Ne-CREs and NEPC-restricted super-enhancers (Ne-SEs). H3K27ac tag density for LuCaP 173.1 is shown in black. f Candidate master transcription factors in NEPC and PRAD based on regulatory clique enrichment (see methods). g Three most significantly enriched nucleotide motifs present in >10% of Ad-CREs or Ne-CREs by de novo motif analysis. Source data are provided as a Source Data file.

