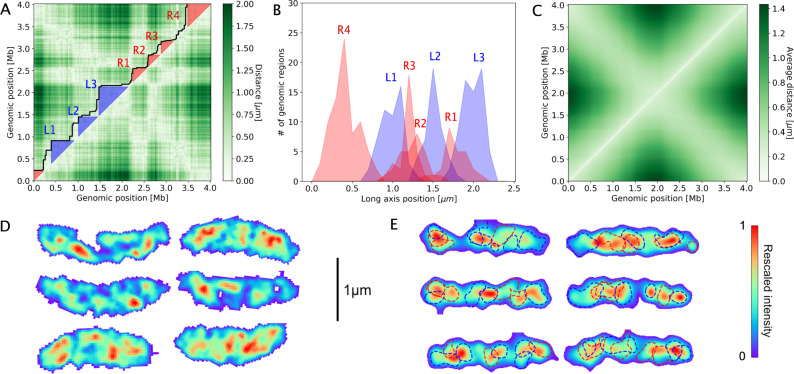
Fig. 4. Long-axis organization is associated with Super Domain formation.
A Distance map for pairs of genomic regions for one chromosomal configuration. The inferred outlines (Supplementary Note 9) of Super Domains (SuDs) are indicated by a black line, with left/right-arm SuDs shaded blue/red. B Long axis distribution of genomic regions in SuDs identified in the configuration depicted in A. C Average spatial distances between genomic regions. D Super-resolution microscopy images of DAPI-stained DNA inside six synchronized C. crescentus swarmer cells. The color code reflects the DAPI fluorescence signal at each pixel, rescaled so that the maximum is at 1 for each cell. E Chromosome density plot with the same scaling of several randomly chosen chromosome configurations from our MaxEnt model (with Gaussian blur applied that matches the experimental resolution). Dashed lines indicate the half-maximum density contour of each SuD (identified by the clustering analysis in Supplementary Note 9), with the line color indicating if a SuD predominantly forms on the right (0–2 Mb, blue) or left (2–4 Mb red) chromosomal arm.

