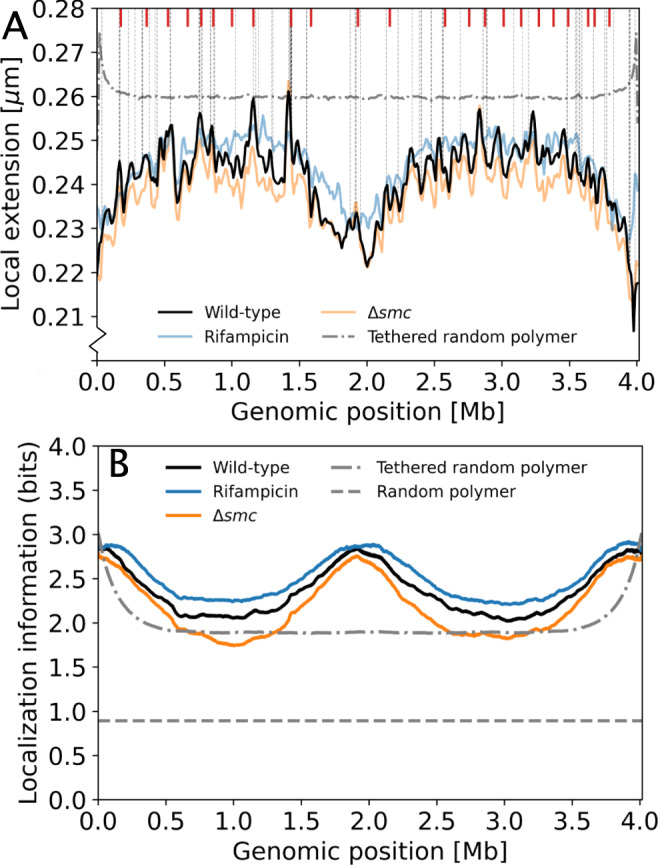
Fig. 5. The MaxEnt model reveals local features and localization information encoded by chromosome organization.

A The local chromosome extension δi as a function of genomic position. δi is defined as the spatial distance between neighboring genomic regions of site i averaged over all chromosome conformations. Model predictions are shown for wild-type cells (black), rifampicin-treated cells (blue), Δsmc cells (orange), and a pole-tethered random polymer (gray dash-dotted line). The locations of the top 2% highly transcribed genes are indicated by vertical gray dashed lines, the locations of CIDs determined in ref. 26 are indicated by red markers. B Localization information per genomic region in bits for wild-type (black), Δsmc (orange), rifampicin-treated cells (blue), a random pole-tethered polymer (dash-dotted line), and a random polymer (dashed line).
