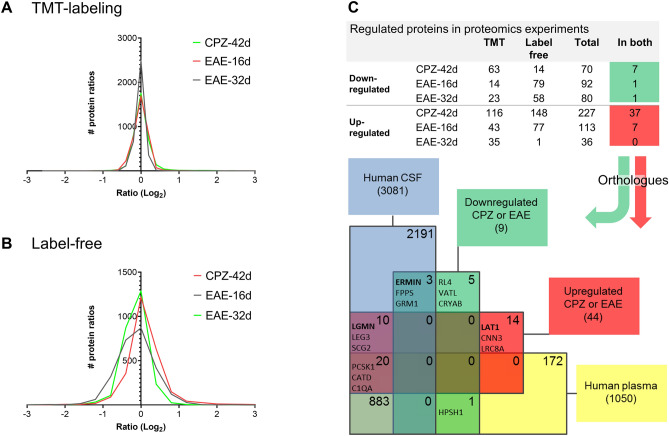
Figure 1.
Proteins quantified in EAE and CPZ frontal cortex and human orthologues in CSF and plasma. (A) Frequency distribution of all normalized log2 ratios for proteins quantified using TMT-labeling in frontal cortex in CPZ-42d, EAE-16d and EAE-32d divided by the respective controls. The TMT data was normalized using the log2 minus the condition median value. The relative numbers of proteins in the ratio bins were automatically determined by GraphPad and presented as continuous lines. (B) Frequency distribution of all normalized log2 ratios for proteins quantified using label-free in frontal cortex in CPZ-42d, EAE-16d and EAE-32d divided by the respective controls. The label-free data was normalized using the default algorithm in Progenesis LC–MS. The relative numbers of proteins in the ratio bins were automatically determined by GraphPad and presented as continuous lines. Slight shifts/shoulders in the frequency distribution plots are due to that the label-free protein quantification is based on the sum of the quantified peptide features with proteins ID’s assigned and the peptides being unique for the protein. The normalization was performed on all peptides. The log2 protein ratios are thus based on a selection of the peptide features from the LC–MS runs. (C) Number of significantly regulated proteins in the conditions CPZ-42d, EAE-16d and EAE-32d relative to respective controls using TMT-labelling and label-free proteomics. The numbers of proteins regulated in both methods are shown, downregulated squared in green and upregulated in red. The human orthologues of the proteins regulated in both TMT and label-free were compared to the CSF and plasma proteins in the CSF-PR database21. The Venn diagram shows how many protein accession numbers that were shared by the respective proteomes, and some of the most relevant regulated proteins.

