Figure 3.
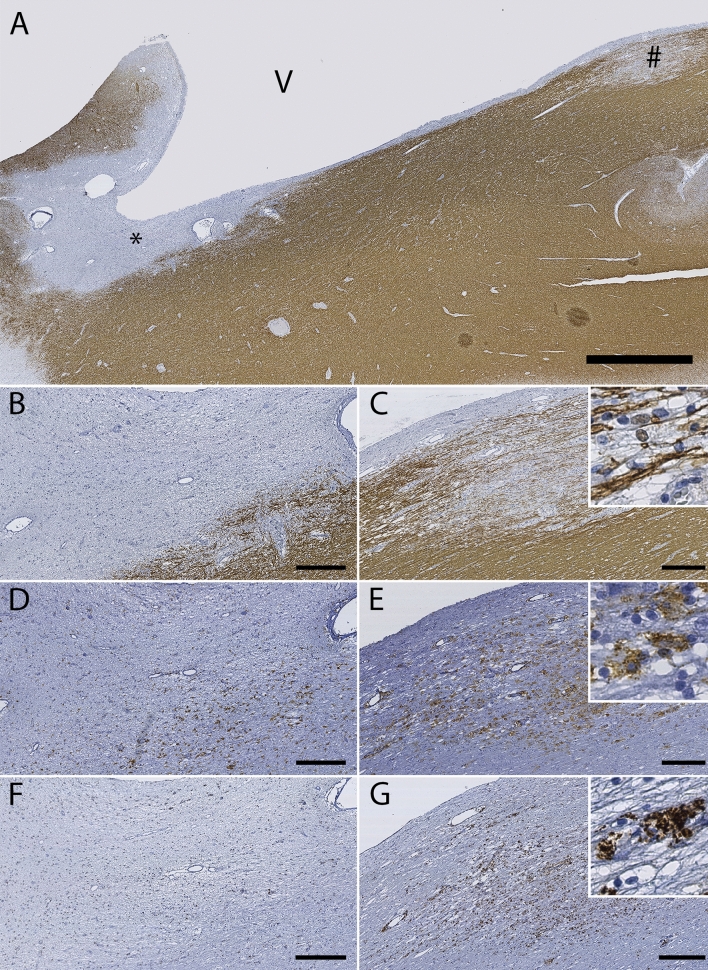
Expression of LGMN in white matter lesions. (A) Myelin (PLP) immunostained section with an active lesion (# in A, images C,E,G) and an inactive lesion (* in A, images B,D,F). Scale bar 2 mm. (B,C) Myelin (PLP) immunostaining of lesions indicated in (A) at higher magnification. Scale bar 300 μm. Insert in (C) shows intracellular PLP-positive myelin debris, suggesting an early active lesion with ongoing demyelination. (D,E) HLA-DR immunostaining of lesions indicated in (A). Scale bar 300 µm. Insert in (E) shows activated HLA-DR positive cells. (F,G) LGMN immunostaining of the lesions indicated in (A). Scale bar 300 µm. In (G), increased LGMN expression is seen throughout the active lesion, while in the chronic inactive lesion (F), there is reduced LGMN expression, due to general hypocellularity and absence of HLA-DR positive cells. Insert in (G) shows a representative image of LGMN immunostaining in a pattern compatible with cytoplasmic lysosomes.

