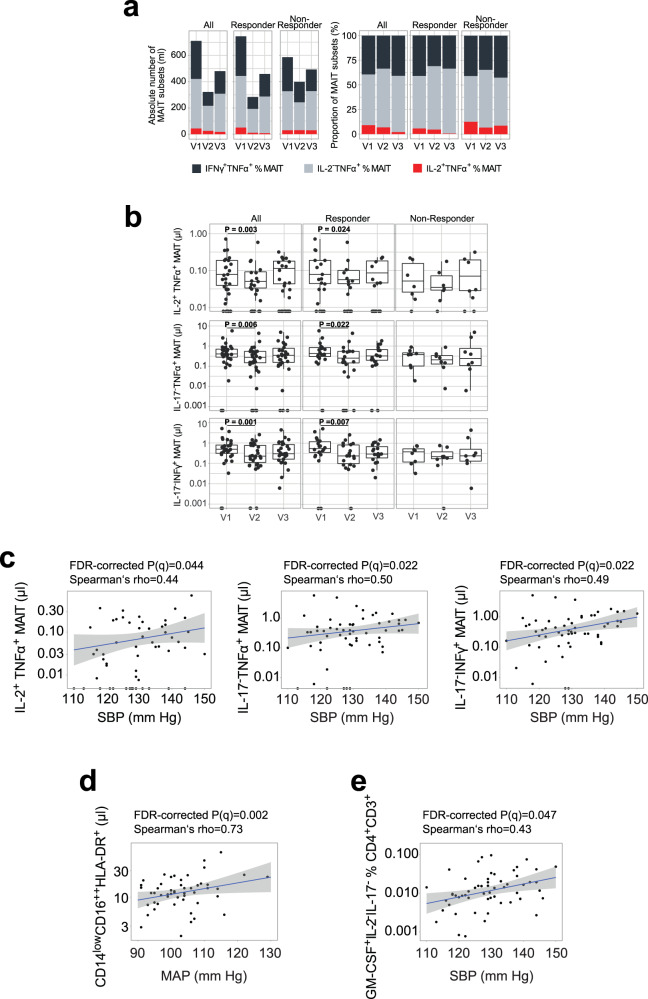
Fig. 6. The association between blood pressure and specific circulating immune cell populations.
a Cumulative absolute number and relative abundance of circulating IFNγ+TNFα+, IL-2−TNFα+ and IL-2+TNFα+ mucosa-associated invariant T cells (MAIT) cells within the fasting arm subdivided by BP responsiveness (median, n = 30 for all, n = 20 for responders, n = 8 for non-responders, respectively). Absolute number of circulating IL-2+TNFα+ (All: P = 0.019, Responder: P = 0.024), TNFα+ (All: P = 0.006; Responder: P = 0.022) and IFNγ+ (All: P = 0.001; Responder: P = 0.007); (a) two-sided MWU test after Benjamini–Hochberg correction. b MAIT cells within the fasting arm subdivided by BP responsiveness (n-number as in (a); two-sided MWU test after Benjamini–Hochberg correction). c Correlations of circulating IL-2+TNFα+, TNFα+, and IFNγ+ MAIT cells and 24 h ambulatory SBP (*FDR-corrected P = 0.044, 0.022, and 0.022, respectively). d Correlations of circulating non-classical CD14lowCD16++HLA-DR+ monocytes and 24 h ambulatory MAP in responder (FDR-corrected P = 0.002). e Correlations of circulating GM-CSF+IL-2−IL-17− of % CD3+ and 24 h ambulatory SBP (FDR-corrected P = 0.047). n-number for (c–g) as in (b). MAIT: Vα7.2+CD161+CD4−CD3+. Boxplot hinges denote 25th–75th percentile. Line within the boxplot indicates median. Whiskers are drawn to minimum and maximum values, but not further than 1.5 × IQR. c–e Gray shading represents 95% CI.

