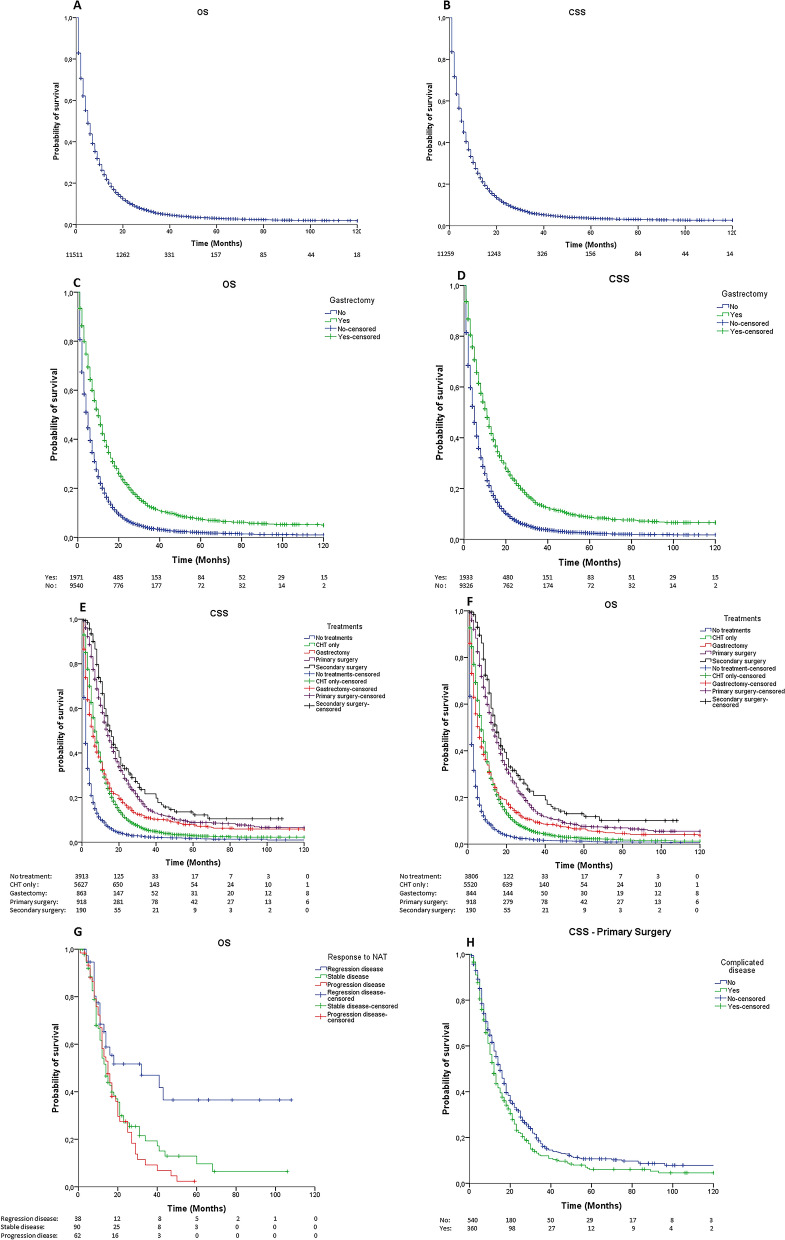
Figure 1.
A, B Kaplan-Meier curve of overall survival (A) and cancer-specific survival (B). C, D Kaplan-Meier curves comparing OS (A) and CSS (B) between patients underwent or not gastrectomy (log-rank p < 0.0001). E, F Kaplan-Meier curves of OS (A) and CSS (B) among the different treatment groups (log-rank p < 0.0001). G Kaplan-Meier curves of OS comparing different pre-operative chemotherapy results in patients underwent secondary gastrectomy (log-rank p = 0.007). H Kaplan-Meier curves of OS comparing the effect caused by a complicated disease among patients underwent primary gastrectomy (log-rank p = 0.009)

