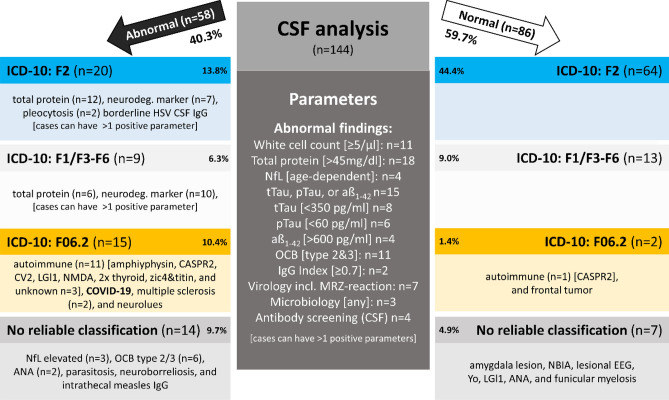
Figure 2.
CSF analysis. The dichotomized categorization into abnormal (left) vs. normal (right) CSF was made according to the middle dark grey box's criteria. Cases can have more than one positive parameter; therefore, the sum of all findings does not add up to 100% of cases. The reported proportions are percentages of the entire cohort (n = 144). Age-dependent CSF NfL cutoffs were used according to Yilmaz28 (see also Supplementary Table 1). All cases were then analyzed using further examination results described in the operationalized group assignment procedure (see Fig. 1 for details).

