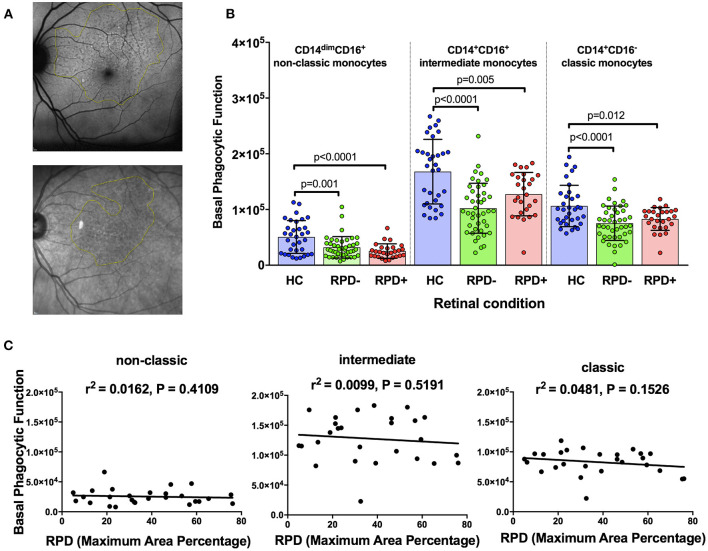
Figure 3.
Phagocytic function in participants with and without reticular pseudodrusen (A) Fundus auto-fluorescence (FAF; top) and near Infrared reflectance (NIR; bottom) spectroscopy images showing reticular pseudodrusen (RPD) area outlined using Image J software. (B) Graph showing mean+standard deviation of monocyte phagocytosis in healthy controls (HC, n = 35), subjects with intermediate AMD without RPD (RPD−; n = 42) and intermediate AMD with RPD (RPD+; n = 18). P-values from One-way ANOVA analysis and Tukey's multiple comparisons tests are shown for comparison between specific groups. (C) Correlations of basal phagocytic function of three monocyte subsets with RPD area (n = 60). There was no significant correlation between phagocytosis and drusen area for any of the monocytes examined.

