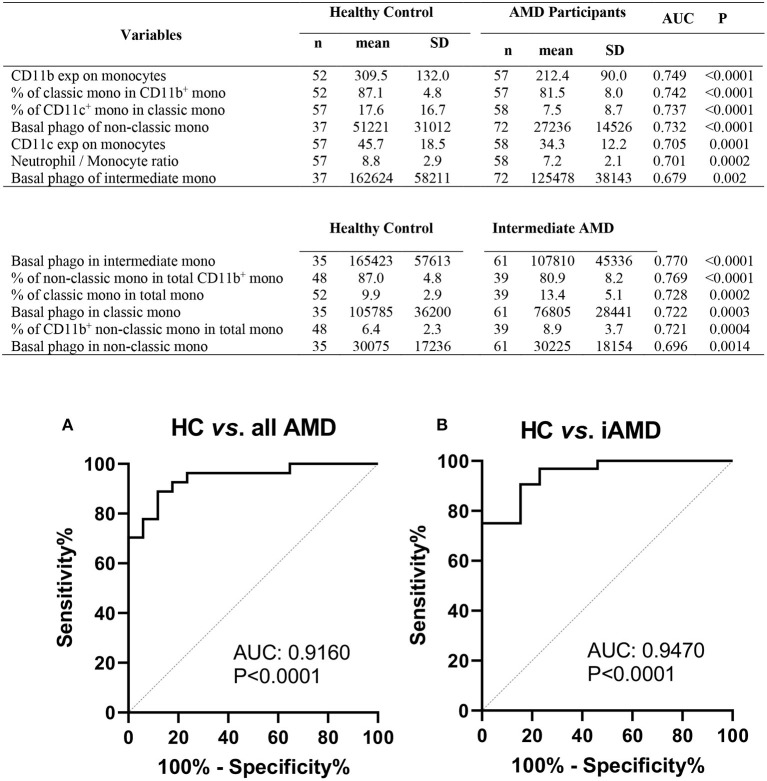
Figure 8.
Phagocytic function and leukocyte biomarkers with potential diagnosis values for AMD. Top potential variables for diagnosis of AMD are shown in the table. AUC, area under curve of Receiver Operating Characteristic (ROC); Mono, monocytes; exp, surface expression; SD, standard deviation; phago, phagocytic function. Binary logistic regression was performed among selected multiple variables to create predicted probabilities for ROC analysis. ROC curves distinguishing between (A) healthy controls (HC) and all AMD (intermediate, GA and CNV) and (B) HC and intermediate AMD are shown. P-values are for asymptotic significance calculated by SPSS v24.

