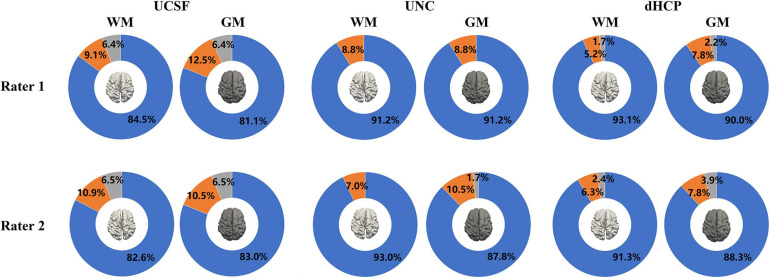
FIGURE 9.
The results of the WM and pial surface QA for all three datasets. Blue represents the proportion of individual surfaces with score 1 (good quality), orange score 2 (fair quality with regional defects), and gray score 3 (poor quality). WM surfaces produced by the proposed method were rated as accurate in 89.2% of scans overall (averaged across three datasets by two raters). Pial surfaces produced by the proposed method were rated as accurate in 86.9% overall.

