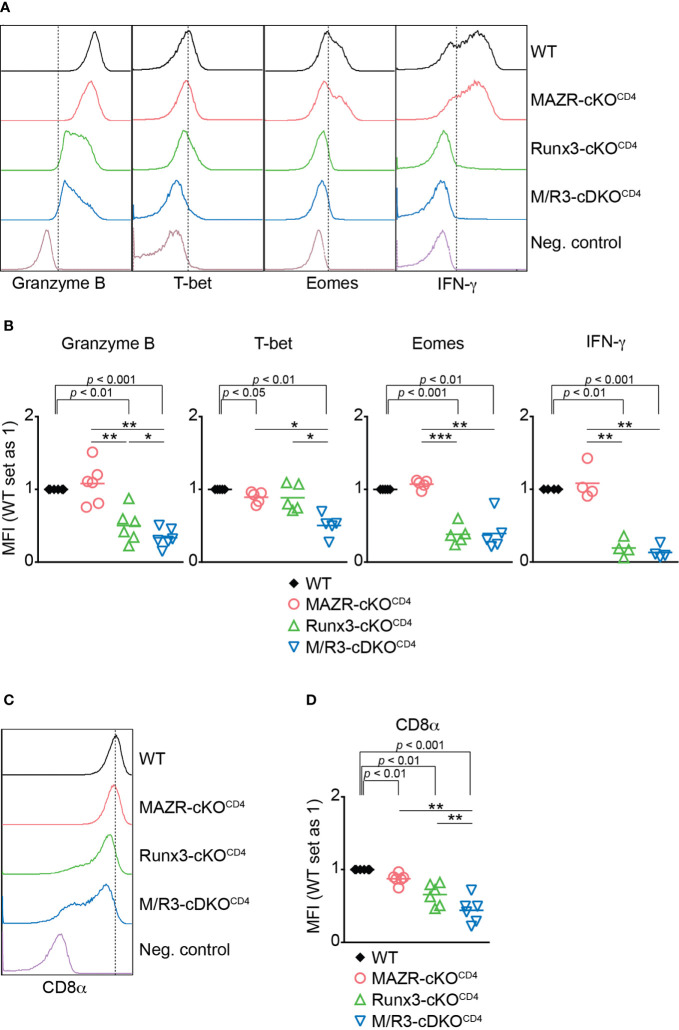
Figure 1.
Combined activities of MAZR and Runx3 are required for appropriate CTL differentiation in vitro. (A) Histograms showing the expression of indicated proteins in the mutant CTLs (6 days after in vitro anti-CD3/28 stimulation). T helper 2 (Th2) cells as well as WT CTLs without restimulation were included as negative controls for the stainings of Granzyme B, T-bet and Eomes as well as IFN-γ, respectively. Vertical dotted lines indicate populations expressing the respective proteins based on the negative controls. (B) Diagrams showing the relative mean fluorescence intensity (MFI) of indicated proteins in the mutant CTLs (the values of WT cells set as 1) (C) Histograms showing CD8α expression in the mutant CTLs. Th2 cells were included as a negative control. Vertical dotted line indicates peak of CD8α expression in WT CTLs. (D) Diagrams showing the MFI of CD8α expression in the mutant CTLs (the values of WT cells set as 1). (B, D) For the comparison of values between three mutant groups, a one-way ANOVA analysis was performed. The p-values were defined as following: *p < 0.05; **p < 0.01; ***p < 0.001. For the comparison of the relative MFI values between WT (set as 1) and each mutant group, a one-sample t-test was performed. The p-values were indicated above the diagrams. Data are representative (A, C) or show the summary (B, D) of 4-6 independent experiments.

