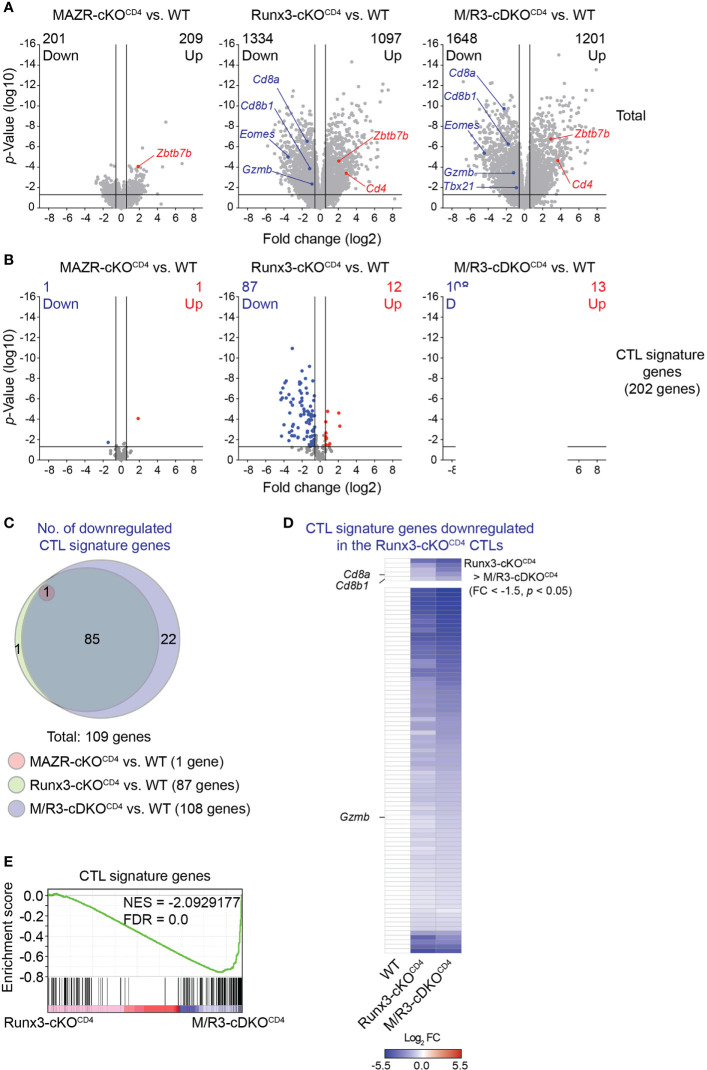
Figure 4.
MAZR plays a compensatory role in the Runx3-dependent transcriptional program of CTL differentiation. (A) Volcano plots showing differentially expressed genes in the individual mutant CTLs compared to WT cells (6 days after in vitro anti-CD3/28 stimulation). (B) Volcano plots showing the expression pattern of the 202 CTL signature genes in the individual mutant CTLs compared to WT cells. (C) Venn diagrams displaying the overlaps of the downregulated CTL signature genes in the individual mutant CTLs compared to WT cells. Numbers of gene in the respective regions are indicated. (D) Heatmap showing fold change (FC; log2 transformed) differences of 87 CTL signature genes downregulated in R3-cDKOCD4 CTLs compared to WT cells. The expression patterns of the genes in R3-cDKOCD4 and M/R3-cDKOCD4 CTLs are shown (mean expression levels of WT CTLs were set as 1). Five genes further downmodulated in M/R3-cDKOCD4 CTLs (based on a threshold of FC > 1.5 and p-value < 0.05) and the rest 82 genes are presented in the upper and lower panels, respectively. Names of the selected genes (i.e. the Cd8a, Cd8b1 and Gzmb genes) are indicated at the left. (E) Gene set enrichment analysis of the CTL signature genes in the gene expression profile of M/R3-cDKOCD4 CTLs in comparison to Runx3-cDKOCD4. NES, normalized enrichment score; FDR, false-discovery rate. (A,B) Cutoff lines of 1.5-fold change as well as p-value < 0.05 were indicated in plots.

