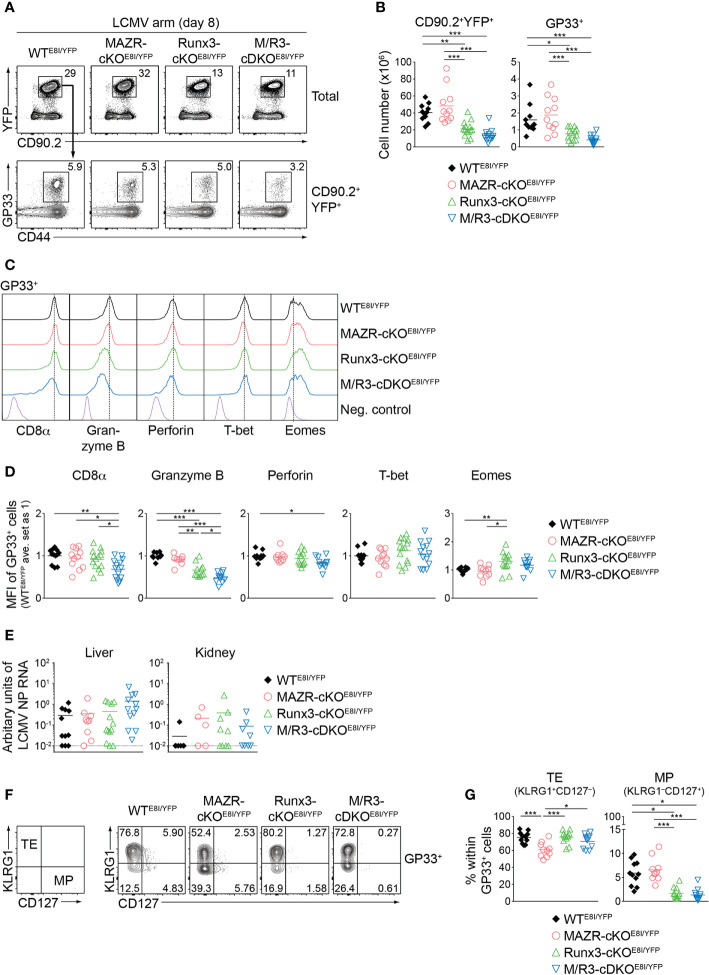
Figure 6.
MAZR and Runx3 cooperatively regulate in vivo CTL differentiation in response to viral infection. (A) Flow cytometric analysis showing CD90.2 and YFP expression in total splenocytes (upper panel), CD44 expression and H2-Db/GP33-41 tetramer (GP33) staining (lower panel) of CD90.2+YFP+ splenocytes of the mutant mice (8 days after LCMV Armstrong infection). (B) Diagrams showing the cell numbers of CD90.2+YFP+, and CD90.2+YFP+GP33+ (GP33+) splenocytes of the mutant mice. (C) Histograms showing the expression of indicated proteins in GP33+ splenocytes of the indicated genotypes. As negative staining controls naïve CD4+ T cells (for CD8α) and naïve CD8+CD44lo cells (for Granzyme B, Perforin, T-bet and Eomes) from uninfected WT mice were included. Vertical dotted lines indicate the peaks of expression of the individual proteins in WT CTLs. (D) Diagrams showing the relative mean fluorescence intensity (MFI) of indicated proteins in GP33+ splenocytes of the indicated genotypes. The average values of WTE8I/YFP mice were set as 1. (E) qRT-PCR analysis of the abundance of transcripts encoding LCMV nucleoprotein (NP) in the livers and kidneys isolated from mice of the indicated genotypes. Results are presented relative to those of control transcripts encoding ribosomal protein lateral stalk subunit P0 (Rplp0). The long dashed horizontal lines indicate the limit of detection. (F) Flow cytometric analysis showing KLRG1 and CD127 expression in GP33+ splenocytes of the indicated. The panel on the left indicates the definition of individual subsets: KLRG1+CD127– terminal effector (TE) and KLRG1–CD127+ memory precursor (MP) cells. (G) Diagrams show the percentage of MP and TE subsets within GP33+ splenocytes of the indicated genotypes. (A,F) Numbers indicate percentages of the respective subsets. (B, D, E, G) Each dot represents one mouse. The horizontal bars indicate the mean. *p < 0.05; **p < 0.01; ***, p < 0.001 (one-way ANOVA analysis followed by Tukey’s multiple-comparison test). Data are representative (A, C, F) or show the summary (B, D, E, G) of more than 10 mice analyzed in at least 5 independent experiments (except for the analysis of viral titers in kidney (E), where 5-9 mice from 6 independent experiments were included).

