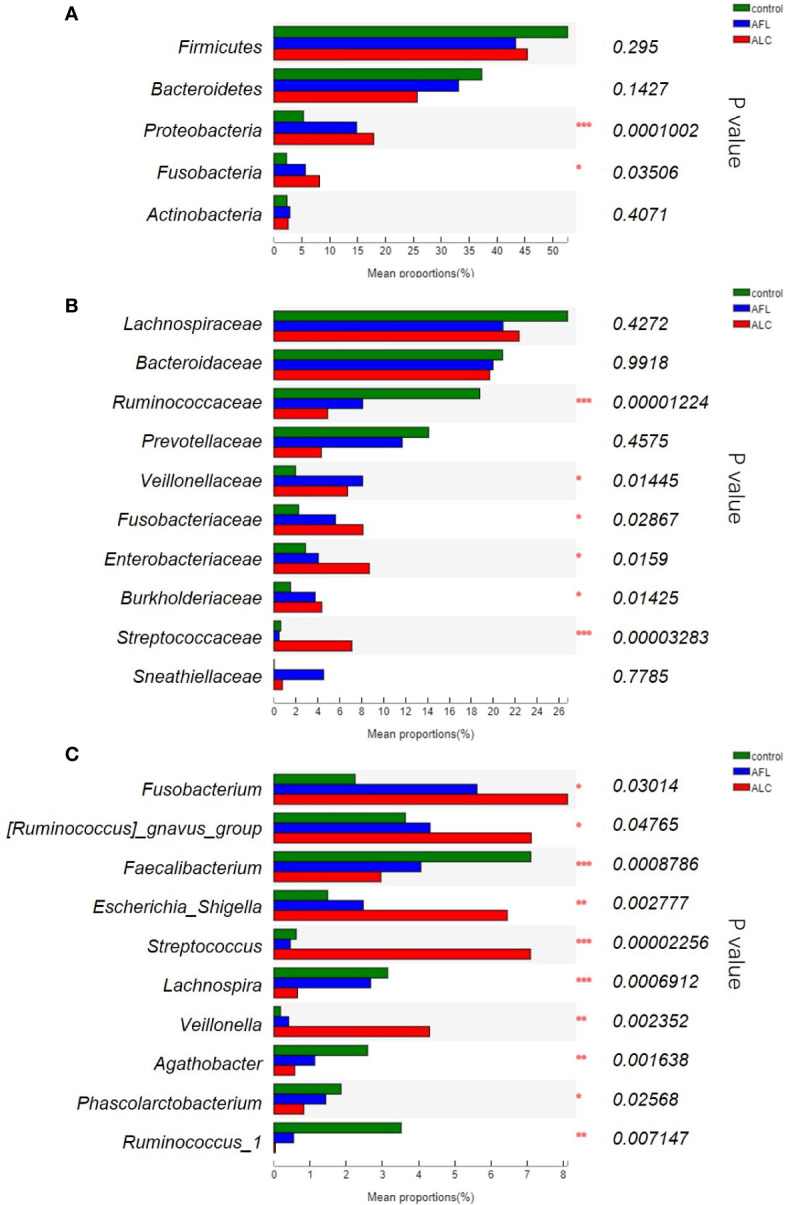
Figure 2.

The relative abundance of the gut microbiota between three groups. (A) At the phylum level, (B) at the family level, (C) significant differences between bacteria at the genus level. Statistical analysis was performed by the Kruskal–Wallis H test. *P < 0.05, **P < 0.01, ***P < 0.001.
