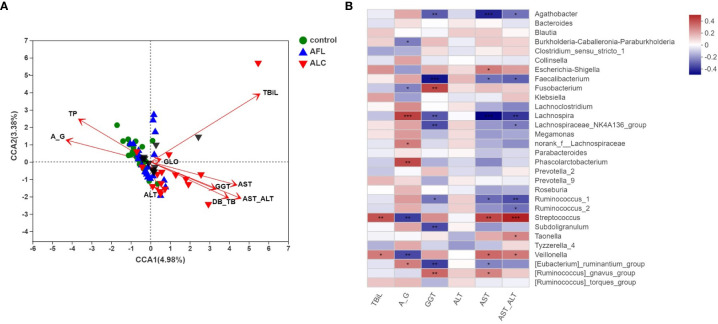
Figure 4.
Correlation analysis of the structures of gut microbiota and clinical factors. (A) CCA analysis on genus level showed the correlations between the bacterial community structures and the indicators of clinical laboratory tests. (B) Heatmap analysis of the correlation between the top 30 predominant bacteria at genus level and the clinical factors. Red spots represent a positive correlation, while blue spots represent a negative correlation. *P < 0.05, **P < 0.01, ***P < 0.001.

