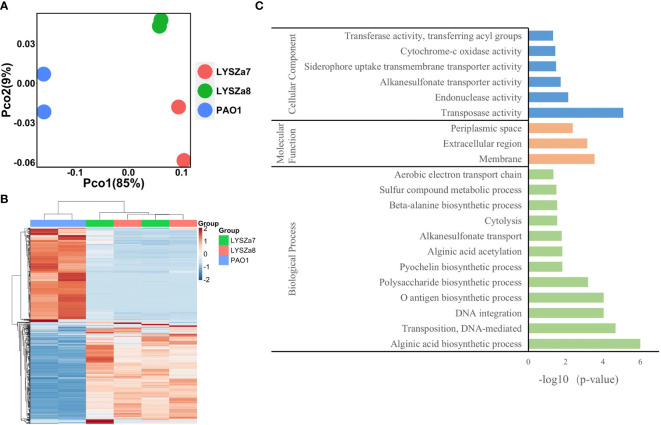
Figure 5.
Dissimilarity analysis of samples and Gene Orthology analysis of differentially expressed genes; (A) PCoA plot of P. aeruginosa PAO1, LYSZa7 and LYSZa8 by Bray Curtis dissimilarity; (B) Heatmap of PAO1, LYSZa7 and LYSZa8 based on euclidean clustering distance; (C) Gene Orthology Enrichment based on the significantly regulated genes (fold change ≧ 4, adjusted p-value < 0.05) in LYSZa7 comparing to those of PAO1.

