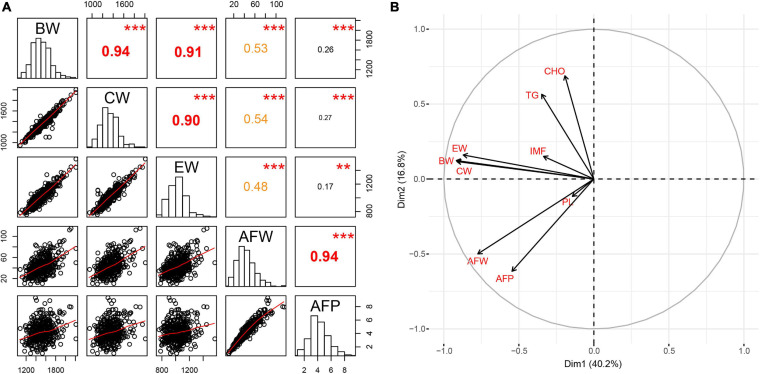
FIGURE 1.
Characterization of host phenotypes. (A) The statistic distribution of and correlations among each phenotype, while (B) shows the principal components of the carcass traits, the abdominal fat deposition, and the pectoralis lipid composition. BW, body weight; CW, carcass weight; EW, eviscerated weight; AFW, abdominal fat weight; AFP, abdominal fat percentage; IMF, intramuscular fat; TG, triglyceride; PL, phospholipid; CHO, cholesterol. The value in the upper triangular matrix represents the correlation coefficient; two * represents P < 0.01, and three * represents P < 0.001.

