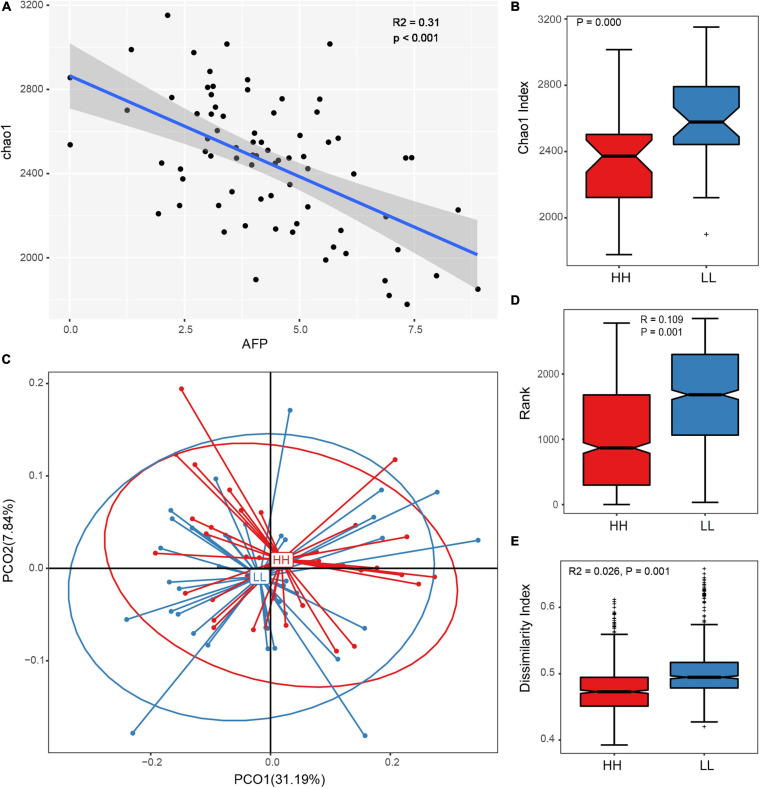
FIGURE 2.
Gut microbial diversity and community with different abdominal fat deposition. (A) The Spearman’s correlation coefficient of the Chao1 index and the AFP of Tiannong Partridge Chickens, each dot represents on samples. (B) The comparison of Chao1 index between the high and low AFP chickens. (C) Represents the result of PCoA analysis based on OTUs of chickens with variant AF. (D,E) The results of Anosim and Adonis analyses. HH, high AFP chickens; LL, low AFP chickens.

