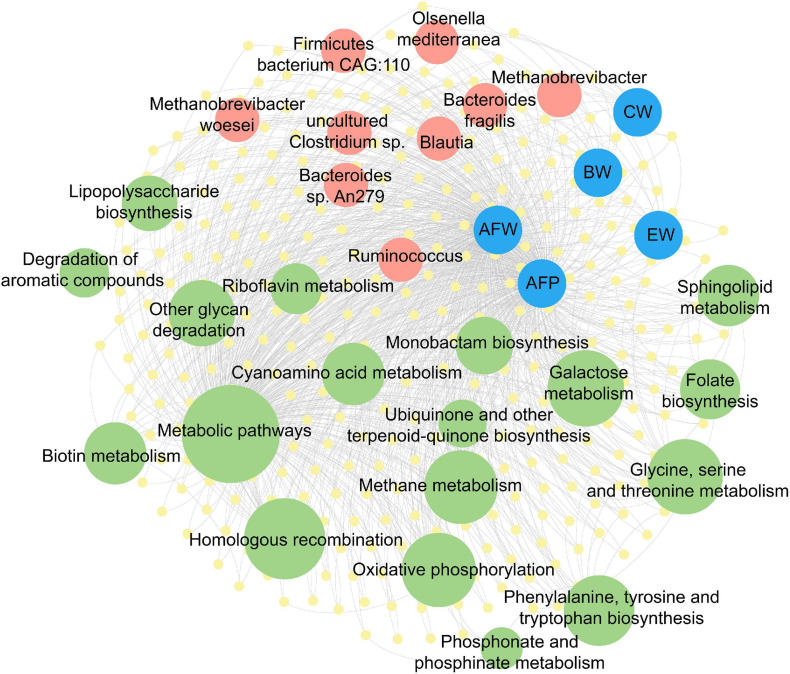
FIGURE 5.
Co-occurrence network of microbial taxa and function capacities with chicken phenotypic traits. The taxa (Red circles) and pathways (green circles) were annotated based on the (yellow circles). The yellow circles represent the differentially expressed genes, red circles represent the differentially enriched taxa, green circles in different size represent the enriched pathways with different degrees of enrichment, while blue circles represent the related chicken phenotypic traits. The gray lines represent edges with Pearson’s correlation coefficient > 0.8 or < −0.8 and P < 0.05. BW, body weight; CW, carcass weight; EW, eviscerated weight; AFW, abdominal fat weight; AFP, abdominal fat percentage.

