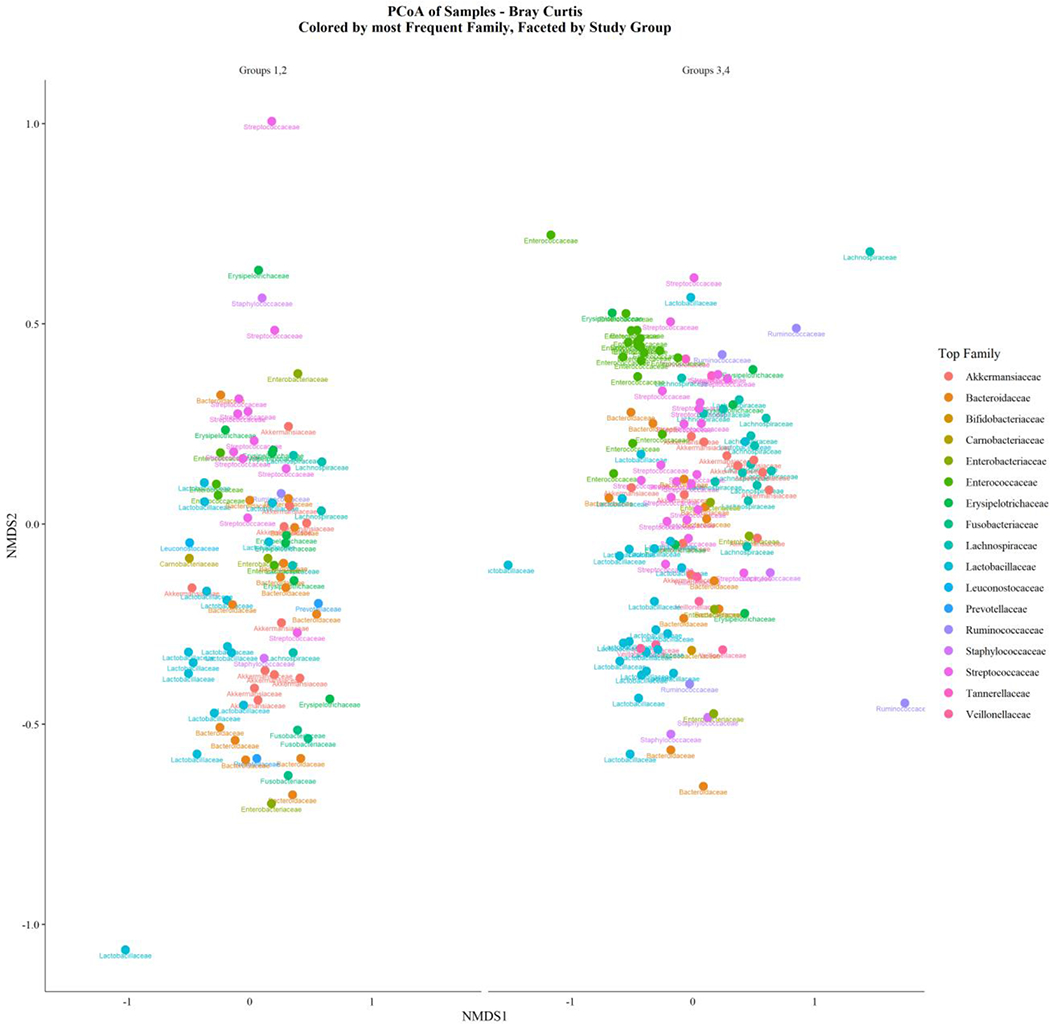
Figure 4. Bray-Curtis non-metric multidimensional scaling comparing community-level taxonomic composition between patients with higher and lower levels of chlorhexidine gluconate use.

Bray-Curtis non-metric multidimensional scaling was performed to examine community level differences in taxonomic composition between patients grouped by CHG usage at the family level. Dots represent single stool samples and are colored based on the most abundant microbial family relative to other families. Groups 1 and 2 represent High and Medium CHG usage groups respectively, groups 3 and 4 refer to Low and No CHG usage groups. In patients with lower CHG use (groups 3 and 4, right), domination relative to other taxa was observed more frequently for members of the Enterococcaceae family (in green) compared to patients with higher CHG usage (groups 1 and 2, left). In contrast, no differences in the frequency of Enterobacteriaceae dominance were observed based on CHG usage.
