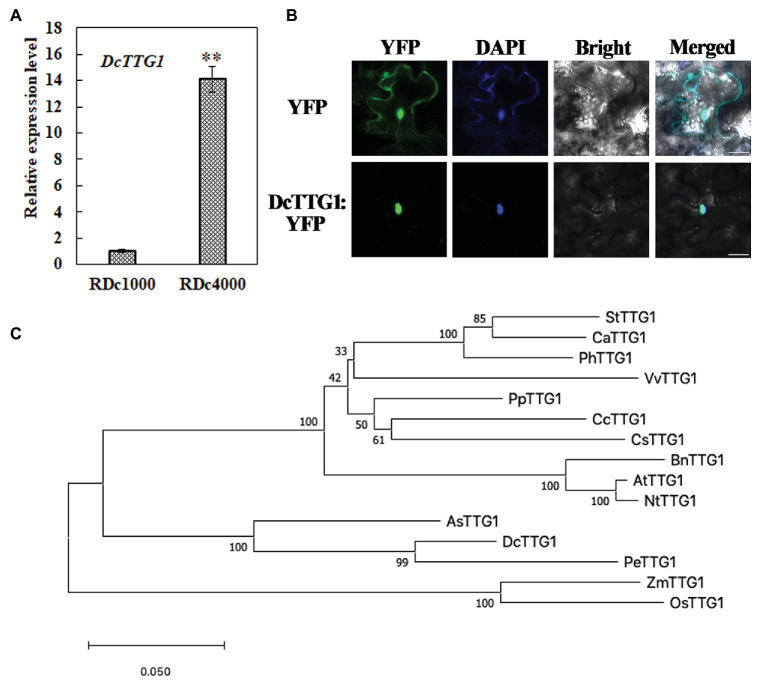
Figure 3.
Phylogenetic, expression, and subcellular localization analyses of DcTTG1. (A) Relative expression of DcTTG1 in RDc1000 and RDc4000 as determined by quantitative reverse transcription PCR (RT-qPCR). DcACT was used as reference gene for normalization. Data represent the mean ± SE of three biological replicates. ∗∗p < 0.01, Student’s t-test. (B) Subcellular localization of DcTTG1. 4,6-Diamidino-2-phenylindole (DAPI) was used as a nuclear marker. The merged image shows the colocalization of the YFP fluorescence signal and the DAPI fluorescence signal. Bar = 20 μm. (C) Phylogenetic analysis of TTG1-like proteins. The following proteins were used to construct the phylogenetic tree: StTTG1 (NP_001305551.1), CaTTG1 (XP_016564215.1), PhTTG1 (AAC18914.1), VvTTG1 (CAN67365.1), PpTTG1 (ACQ65867.1), CcTTG1 (AMQ26245.1), CsTTG1 (NP_001306987.1), BnTTG1 (NP_001303154.1), AtTTG1 (CAC10524.1), NtTTG1 (ACJ06978.1), AsTTG1 (PKA51013.1), PeTTG1 (XP_020583423.1), ZmTTG1 (NP_001310302.1), and OsTTG1 (KAB8088430.1).

